categories
All Categories
- Bitcoin
- Centralised Exchanges
- Crypto
- Crypto Asset Volatility
- Crypto Correlations
- Crypto Governance
- Crypto in the Portfolio
- Crypto Valuations
- DeFi
- ESG
- Ethereum
- Investment Highlight
- Regulation
- Security and Privacy
- Social Media Influence
- Stable Coins
- Traditional Finance and Crypto
- Uncategorized
- UNSDG
- Web 3.0
Authors
All Authors
Crypto Adoption
by David Angliss
Crypto Adoption Rates
2022 has begun as one of the most humbling beginnings to a year for crypto assets. The war in Ukraine, US inflation printing a 40-year high and the collapse of Terra, Three Arrows Capital and Celsius have all contributed to fearful crypto markets. However, despite the turbulence, we continue to see crypto asset adoption remain strong.
The total number of wallet addresses across Bitcoin and Ethereum networks has continued to increase, and their daily active addresses have remained steady, with the total cumulative number of addresses for both assets on the rise. Also, transaction volumes in their native assets BTC and ETH are on average more significant than the values we witnessed last year.
Since its inception, DeFi has displayed very promising adoption; however, when zooming in to recent times, it is no surprise that DeFi, along with the whole market, has had a significant drawback. This decline might seem ultra bearish to the naked eye. However, on-chain analysis can point to DeFi’s resilience when measuring Total Value Locked in DeFi using native blockchain assets as the measuring unit.
We highlight several data points we follow in assessing the ‘fundamentals’ of crypto asset adoption. It is important to note that this data is all publicly available due to the transparent nature of open blockchains.
BTC and ETH Transaction Volume
The transaction volume on Ethereum and Bitcoin is an indicator of network activity. It is important to analyse the transaction volumes in their native tokens, as it can be misleading if the volume is measured in US dollars due to the volatile nature of the underlying asset. Despite negative sentiment, the transaction volume across the Ethereum and Bitcoin networks has remained relatively stable. We see that the daily transaction volume peaked in mid-July for both chains, corresponding to the local price lows of both assets due to liquidation events.
Ethereum: Transaction Volume (ETH)![]()
- Ethereum’s chart shows us a stable transaction volume level across the past 12 months, with jumps in May and mid-June 2022.
- The large spikes in ETH volume were due to the forced selling of ETH collateral from certain crypto-related entities defaulting on their loans.
- Ethereum’s transaction volume has strengthened over the past six months.
- The largest bar is June 14th, when over $320M in ETH liquidations occurred
Bitcoin: Transaction Volume (BTC)![]()
- Bitcoin’s chart displays high volumes over May and June too.
- The large spikes in BTC volume were due to the forced selling of Bitcoin collateral from certain crypto-related entities defaulting on their loans
- The largest bar is June 14th, when over $500M in BTC liquidations occurred
Bitcoin Adoption
Bitcoin has experienced a drastic change in price over the last 12 months. In early November 2021, we saw bitcoin reach record highs of over $68,000. It is trading at $21,500 at the time of writing this article, roughly a 70% decrease since its all-time high. During this period, we can see sustained Bitcoin adoption by analysing;
- The number of new Bitcoin addresses
- The number of active Bitcoin addresses
- Cumulative number of Bitcoin addresses
Below displays the number of new Bitcoin addresses, the number of unique wallet addresses that appeared for the first time with a transaction of Bitcoin over 12 months.
Daily Number of New Bitcoin Addresses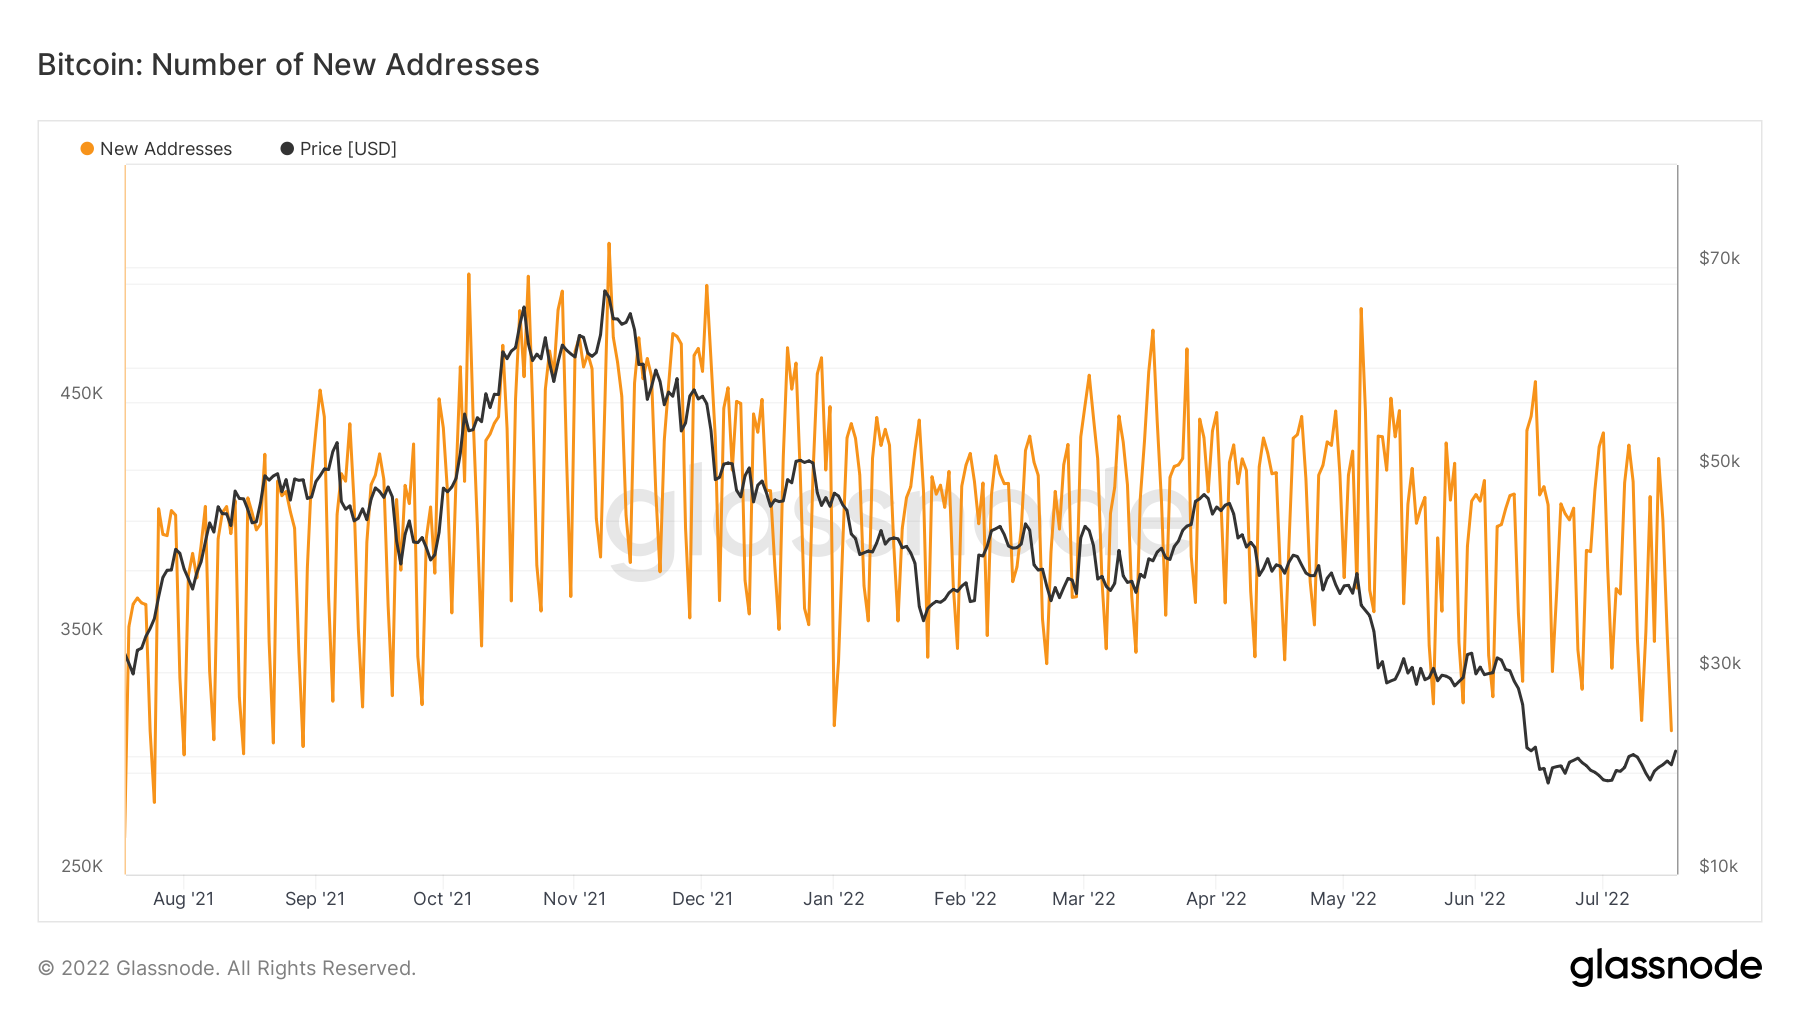
- The number of new addresses fluctuates between 330k and 500k for the majority of the year, this is roughly a 35% fluctuation from the highs to the lows.
- As the Bitcoin price rises and falls over the 12 months, we can see the number of new BTC addresses increase, plateau then slightly decrease, indicating adoption has slowed, but only marginally.
We can also compare the number of daily active users against the price of Bitcoin. The number of active users is defined as the number of unique addresses active in the network either as a sender or receiver. This graph has a similar pattern to the previous chart.
Daily Number of Active Bitcoin Addresses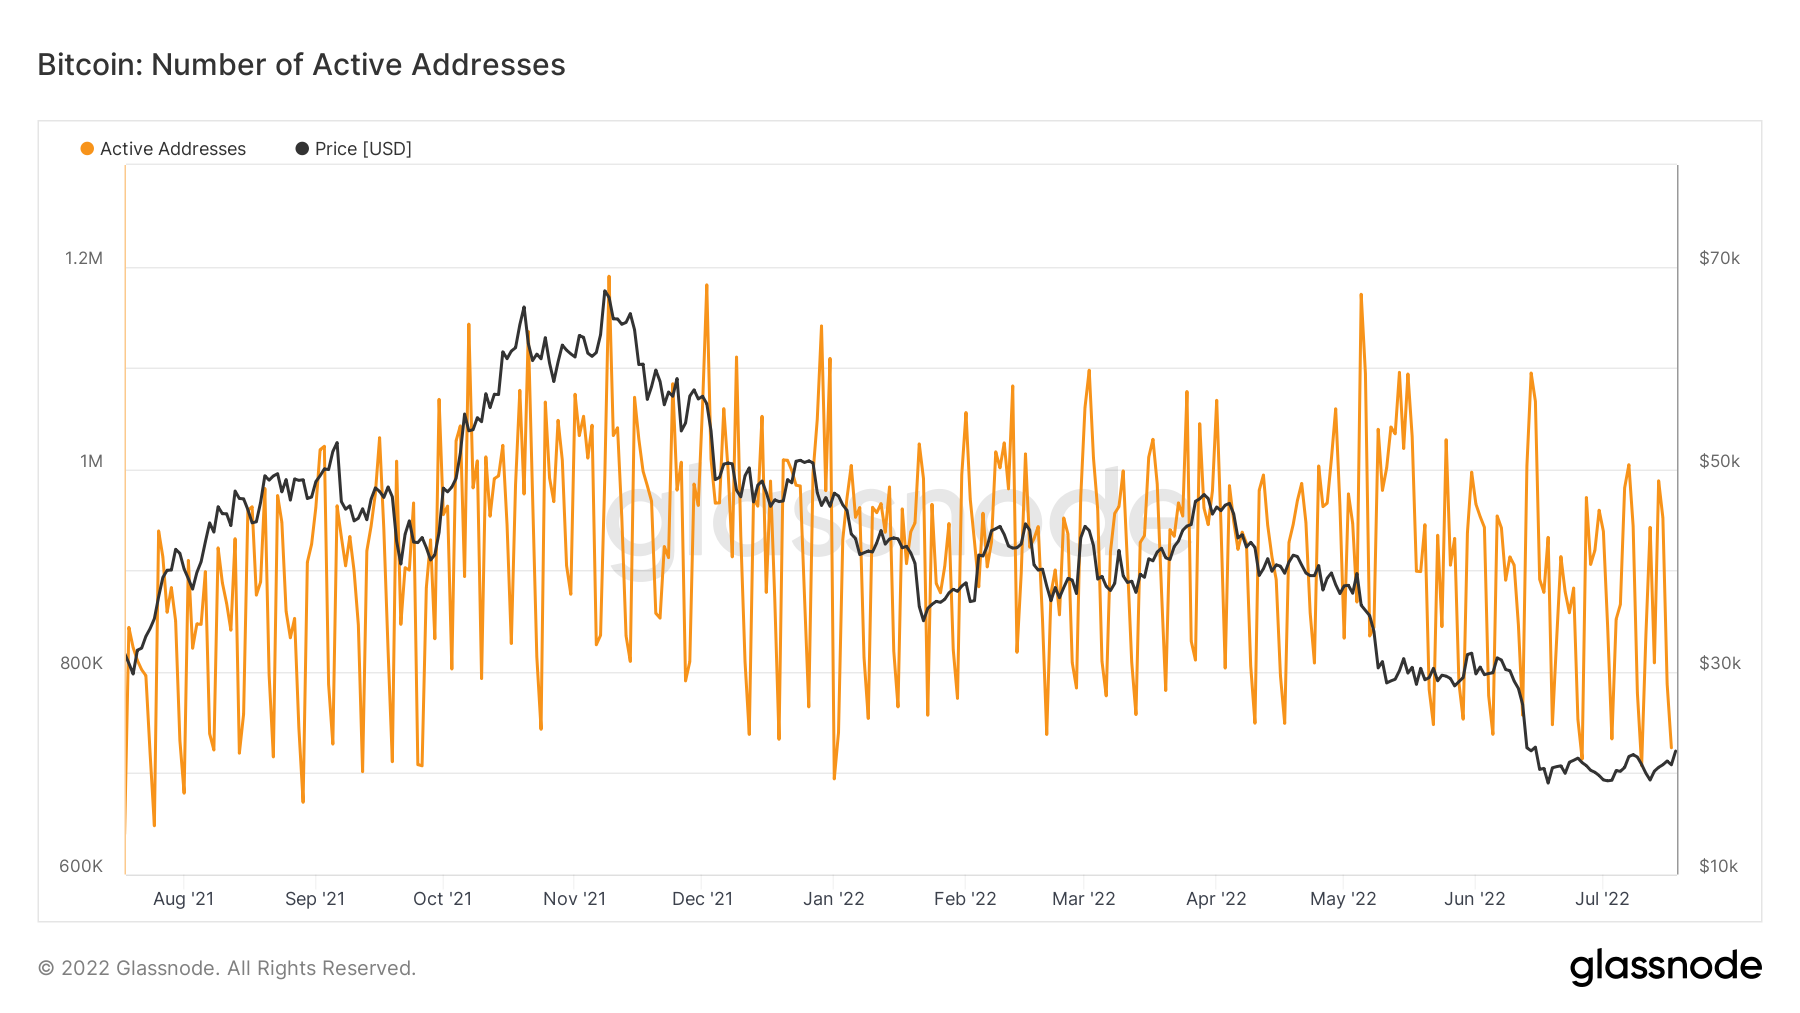
- We see that there hasn’t been a steep decline in the number of active BTC addresses compared to the price movement.
- The daily number of active Bitcoin addresses has ranged from 700k to 1.15m daily. This equates to fluctuations of 40% from the highs to the lows.
- The number of active BTC addresses remains in a stable range over the 12 months
Looking at the cumulative total number of Bitcoin addresses in the past 12 months, it is clear total Bitcoin addresses are on a steady rise.
Total Number of Bitcoin Addresses 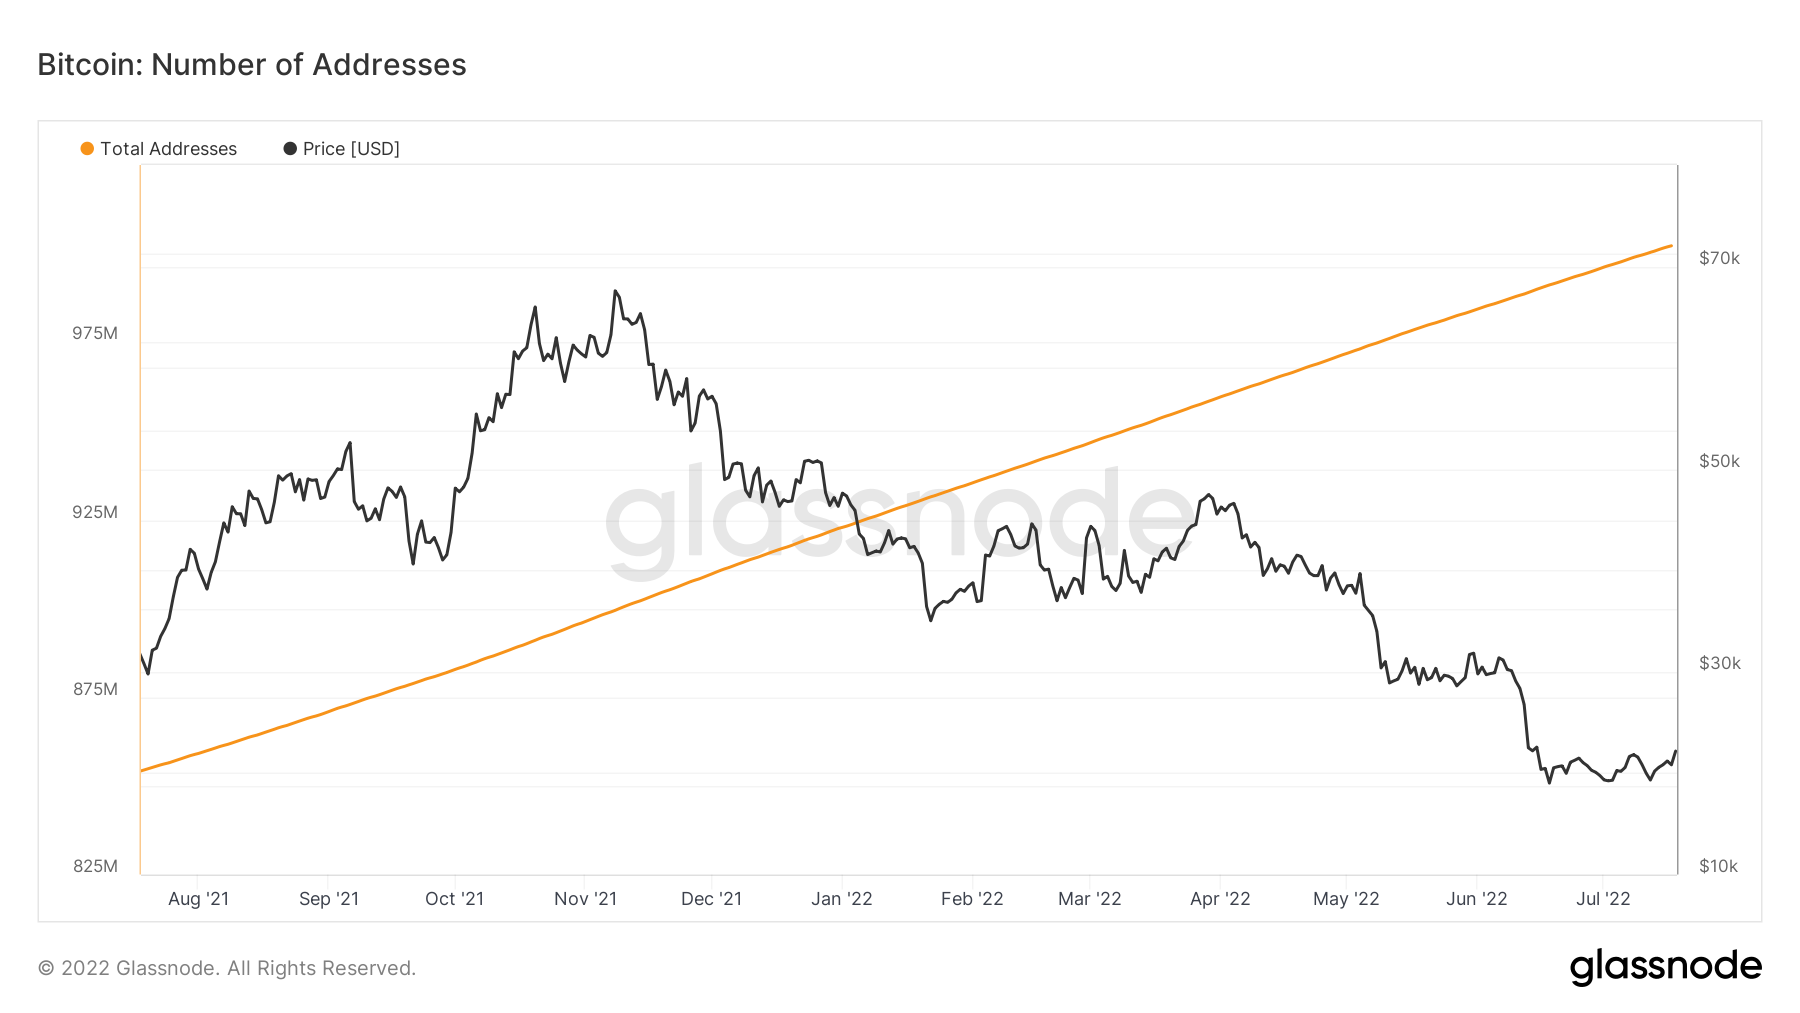
- Bitcoin addresses have increased by 250M from 850M to 1B addresses over the 12 months
- Despite the decreasing price of BTC, the total number of Bitcoin addresses has not plateaued and continues to trend upwards at a constant rate.
Ethereum Adoption
Ethereum has had similar volatility over the last 12 months to Bitcoin. In early November 2021, Ethereum traded at record highs of over $4,800. Now it is trading at $1,450, roughly a 70% decrease from its all-time high. During this time, Ethereum’s wallet adoption rates have been relatively stable compared to its price volatility, which is evident when analysing:
- The number of new Ethereum addresses
- The number of active Ethereum addresses
- Cumulative number of Ethereum addresses
The graph below shows healthy rates in the daily number of new Ethereum wallets relative to its price action.
Daily Number of New Ethereum Addresses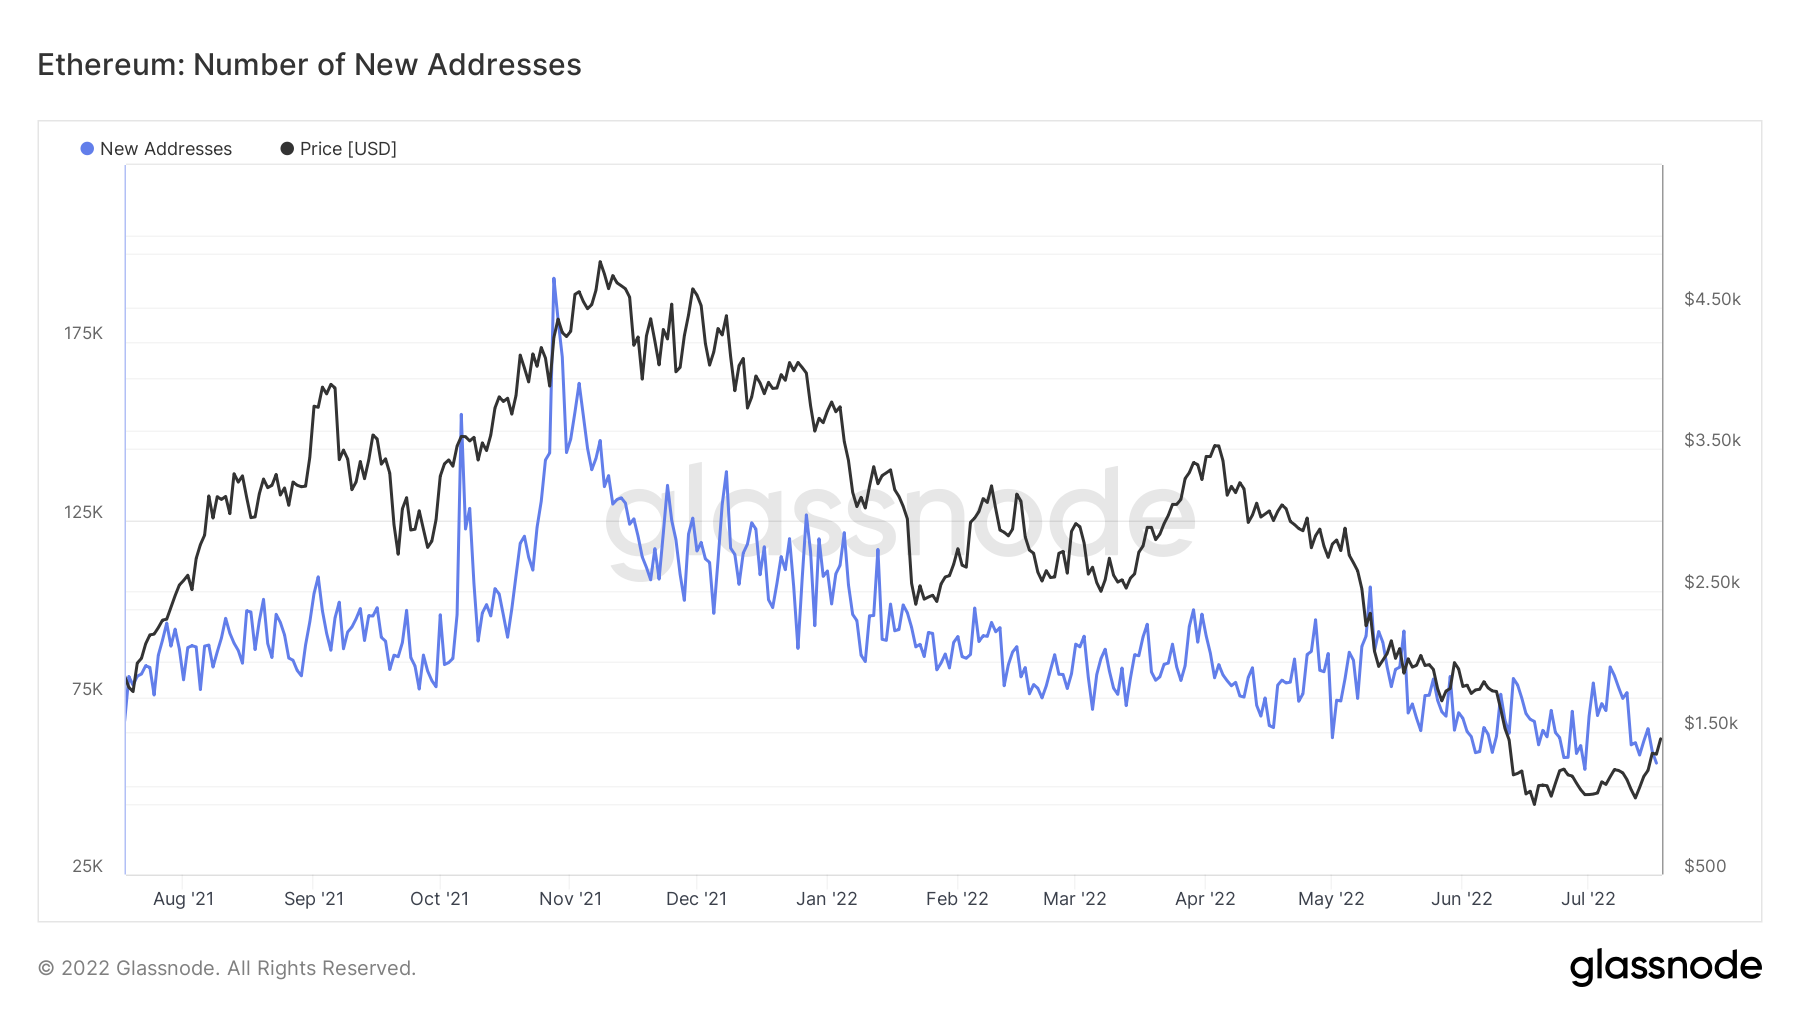
- We see that there has been a more evident decline in the number of new ETH addresses and active ETH addresses in comparison to BTC. The number of new Ethereum addresses has decreased, however, not as sharply as Ethereum’s price.
- The daily number of new ETH address per day range from the lows of 60k to the highs of 125k per day over the 12 month period, representing a difference of 52%, while the price has fallen 70%
- Using a six month timeframe, there have been ranging fluctuations from 60k to 100k daily new addresses, of approximately 40% from highs to lows. In the same six months, Ethereums price dropped from $3,300 to $1,400, representing a 58% decrease.
Daily Number of Active Ethereum Addresses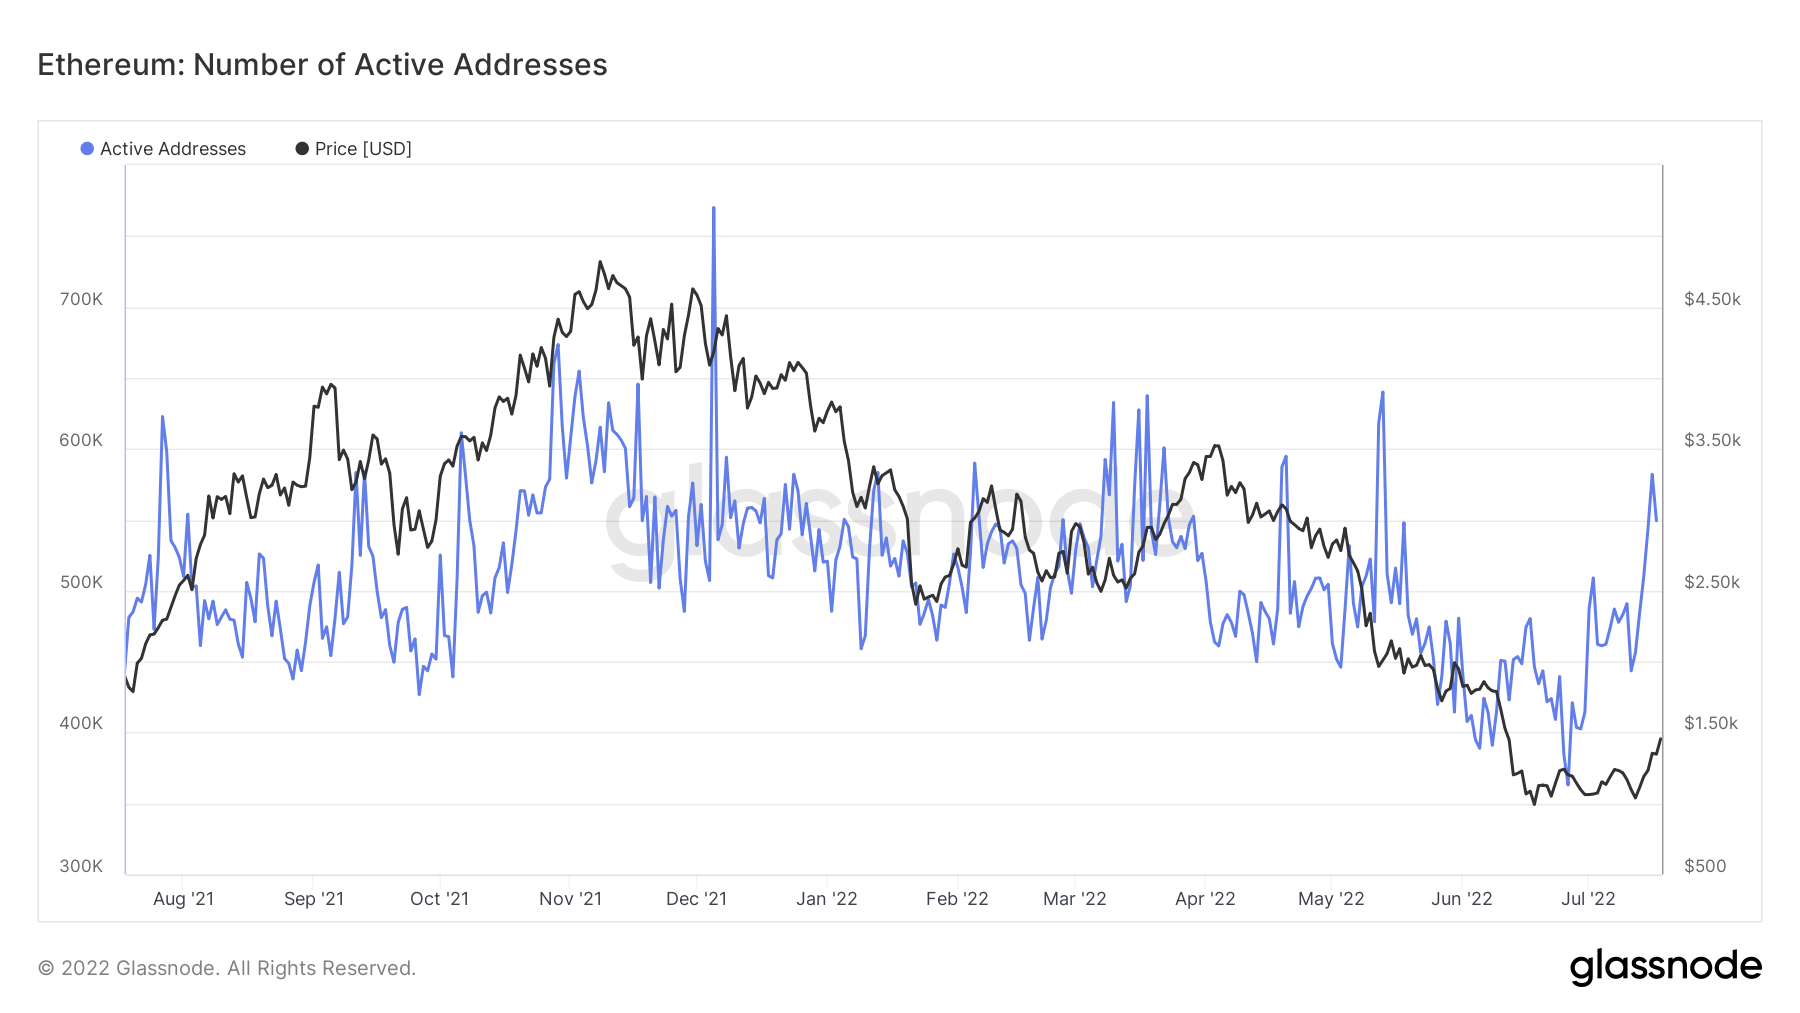
- The number of active Ethereum addresses has decreased, however, not as harshly as Ethereum’s price action.
- The daily number of active ETH addresses has ranged from 650k to 400k per day, equating to 40% difference between highs and lows, whilst ETH price has dropped 70%.
The total number of Ethereum addresses in the 12-month period shows a similar trend to Bitcoin’s pattern.
Total Number of Ethereum Addresses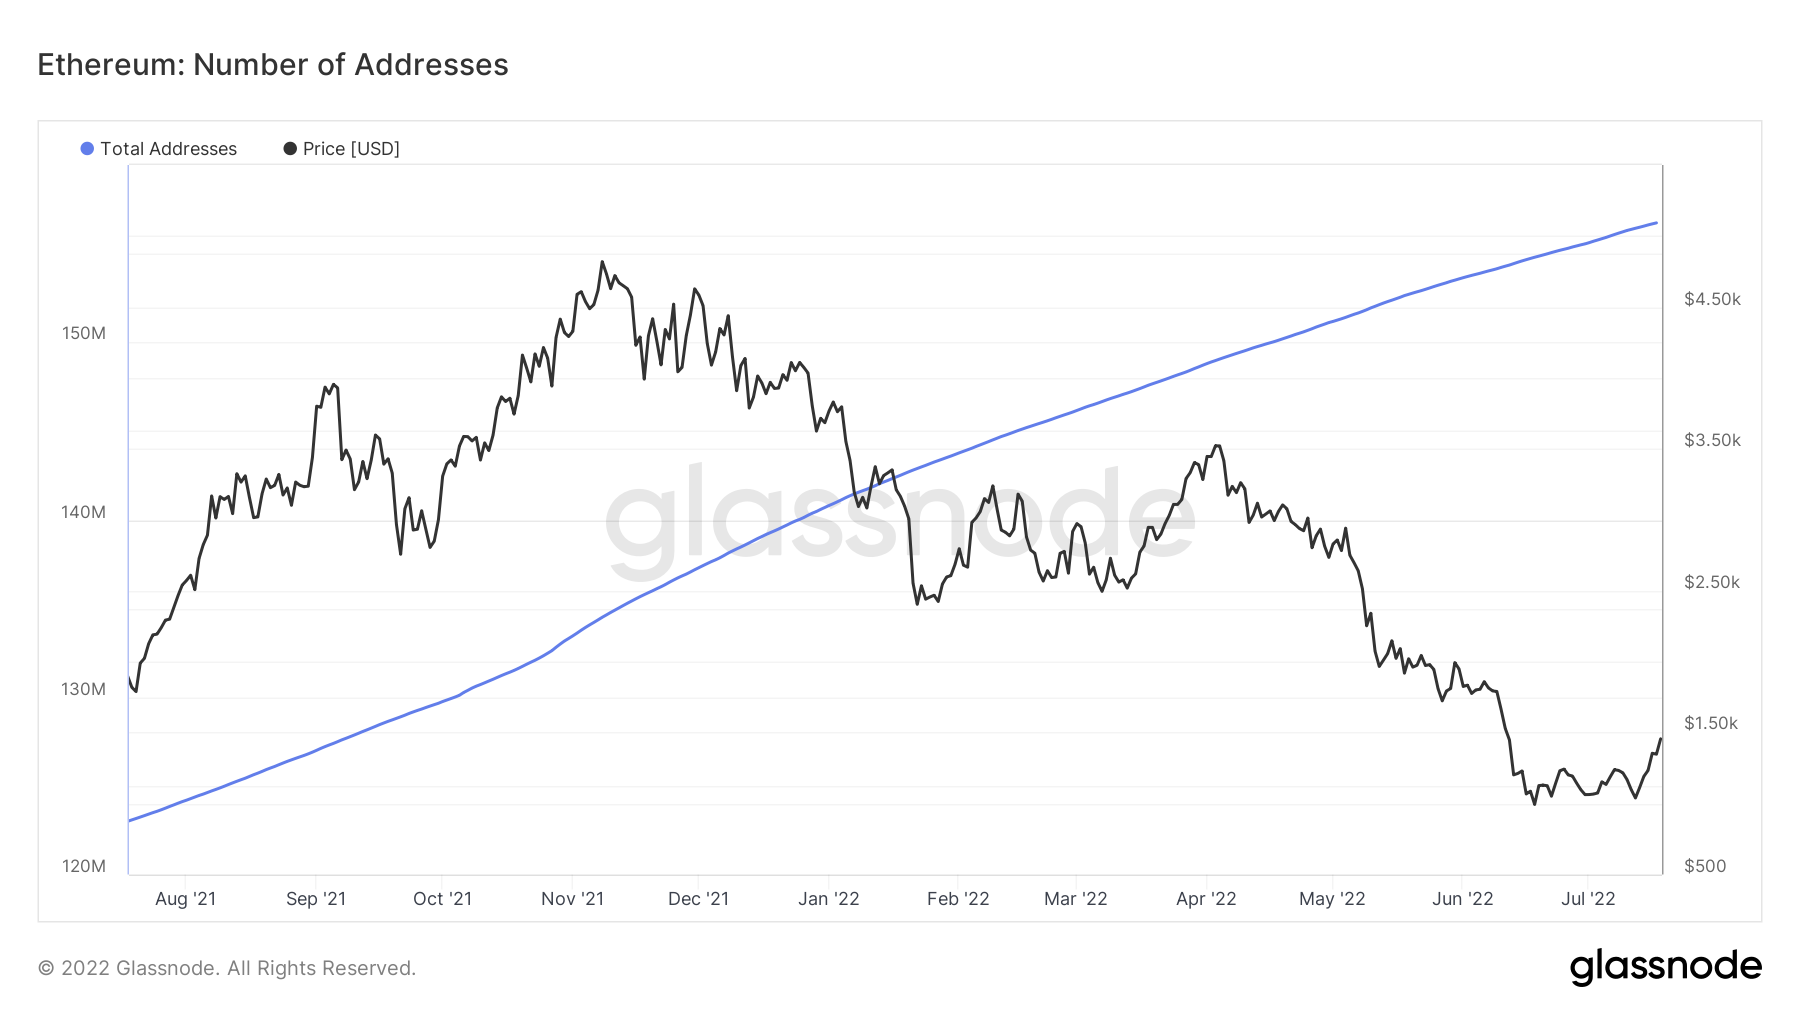
- We can see that the total number of Ethereum addresses continues to trend upwards at a constant rate from 120m to 156m addresses.
BTC Accumulating Addresses
Although Bitcoin prices are at the lowest prices they have been in the last 12 months, the number of addresses with more than one Bitcoin is at all-time highs. This suggests that a growing community of Bitcoin investors becoming more confident in the fundamentals of Bitcoin are comfortable increasing their allocations of Bitcoin and new entrants buying Bitcoin for the first time.
Number Of Bitcoin Addresses With More Than One BTC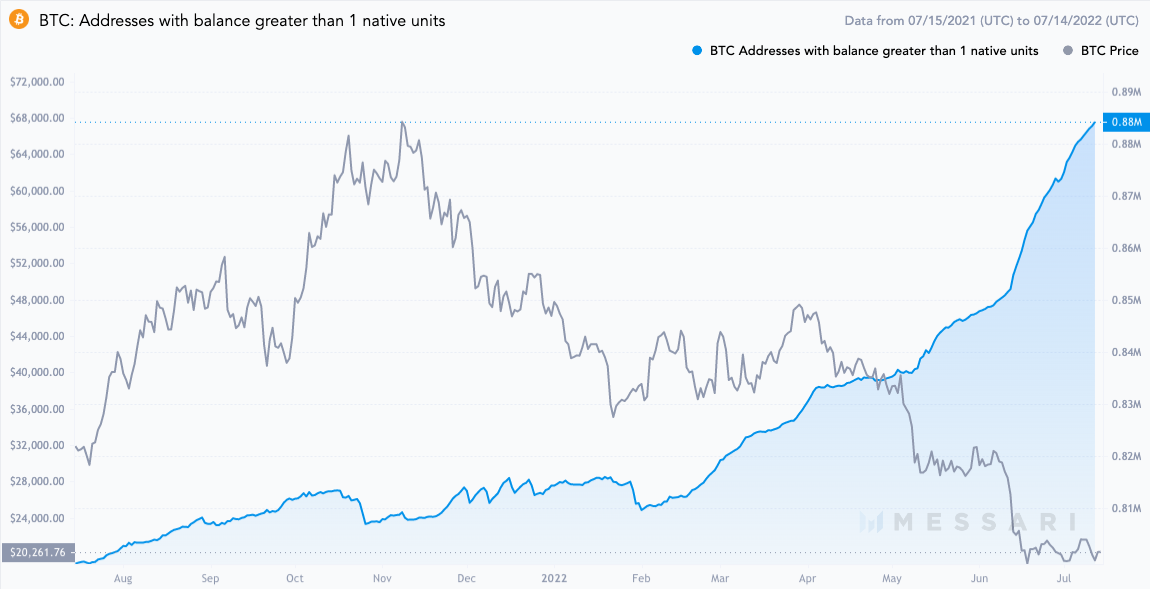
- The Number of addresses with more than one Bitcoin in the last 12 months has increased by 10% this year.
- The number of Bitcoin addresses with more than one Bitcoin is at an all-time high of 883,224.
ETH Accumulating Addresses
Similarly to Bitcoin, whilst prices of Ethereum are at the lowest they have been in the last 12 months, we see that the number of Ethereum addresses holding more than one ETH and more than 10 ETH are at all-time highs. This figure shows that despite current market conditions, more and more investors are accumulating ETH. ETH, like Bitcoin, is also being dispersed over a larger number of addresses.
Number Of Ethereum Addresses With More Than One ETH 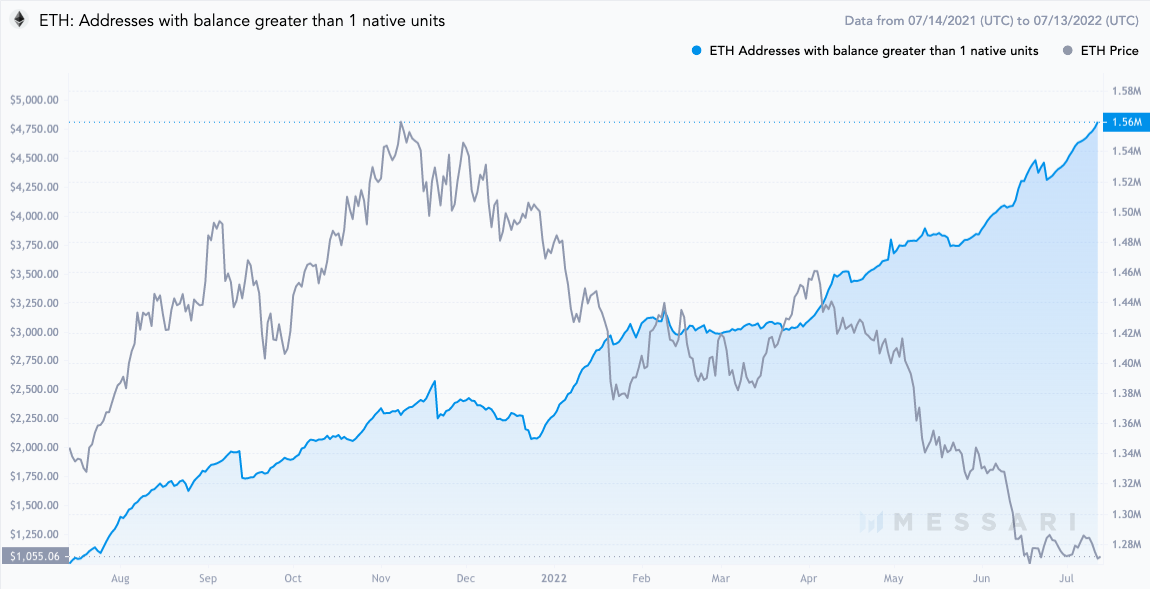
- The number of Ethereum addresses with more than one ETH has increased by approximately 25% in the past 12 months.
- The number of Ethereum addresses with more than one ETH is at an all-time high of 1.56M
Number Of Ethereum Addresses With More Than 10 ETH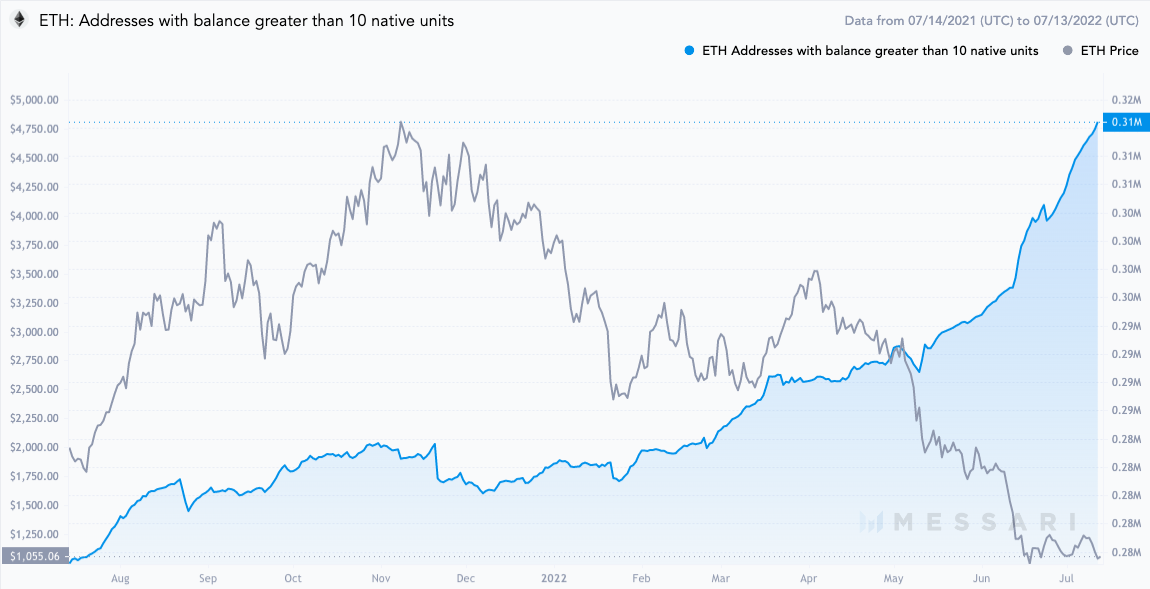
- The number of Ethereum addresses with more than 10 ETH has increased by approximately 11% in the past 12 months.
- The number of Ethereum addresses with more than 10 ETH is at an all-time high of 0.31M.
DeFi Adoption Rates
In the past 24 months, Decentralised Finance (DeFi) has been one of the fastest growing sectors in cryptocurrency. We can measure the growth of DeFi through Total Value Locked (TVL), that is the number of user funds deposited in a decentralised finance (DeFi) protocol. These funds could be locked in the project for several reasons such as staking, liquidity or lending. The two-year chart shows promising figures despite crypto assets’ recent decline. The growth in TVL displayed signifies adoption in layer one blockchains and their corresponding DeFi protocols.
Total TVL in DeFi in $US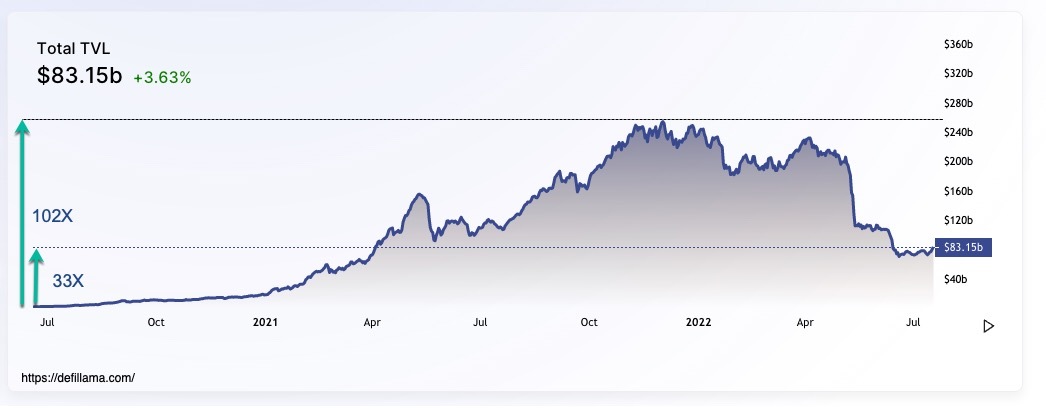
- TVL has grown to 83.15B representing a 33X growth since July 2020
- TVL reached an all-time high of 254B representing a 102X growth since July 2020
Total TVL on Ethereum in ETH
Ethereum’s DeFi ecosystem has had a significant drawback over the past months with the TVL dropping 64% in US dollar terms. This sharp drop can be attributed to the decreasing prices of all crypto assets being locked up on the Ethereum network due to contagion that spread after the Terra/Luna, Three Arrows Capital and Celsius collapse. When comparing the TVL values in US dollar terms with ETH it is encouraging to see that TVL in ETH terms has remained stable. Viewing the charts below we see the value of Ethereum’s DeFi ecosystem is stable when priced in ETH.
Total Value Locked On Ethereum ($US)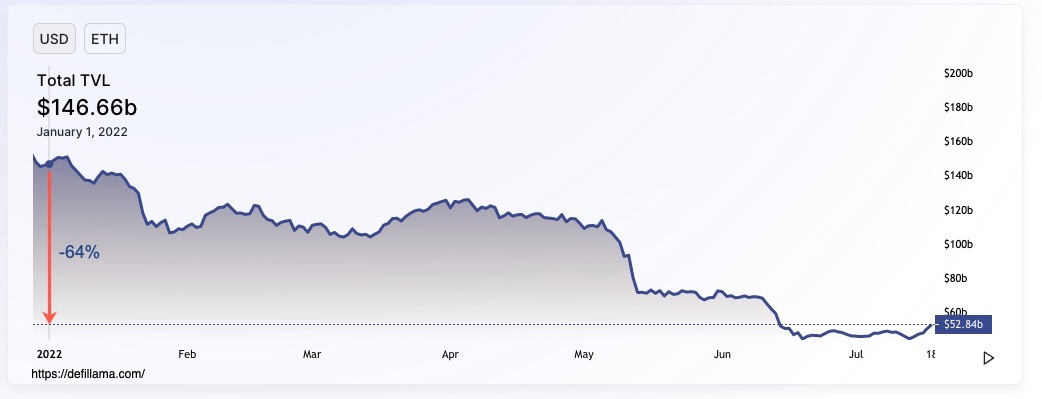
Total Value Locked On Ethereum (ETH)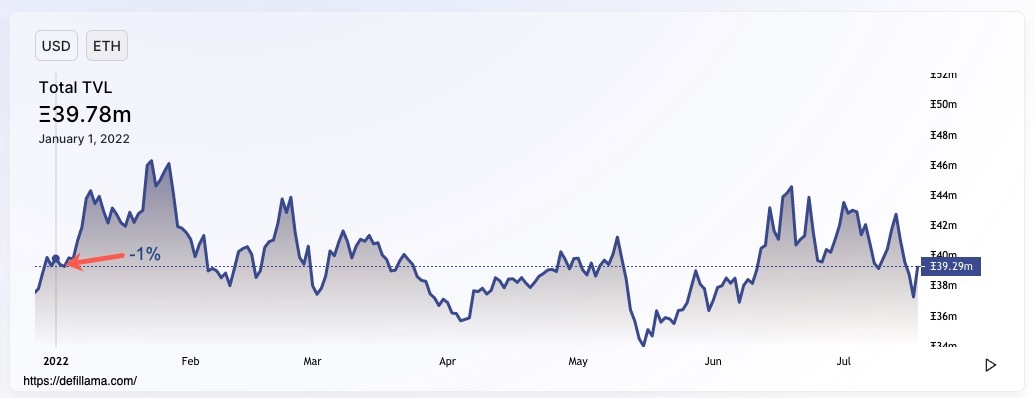
- TVL on Ethereum in $US terms has dropped by 64%
- TVL on Ethereum priced in ETH has only dropped -1% and has remained stable over the last six months
Crypto asset markets have had a severe start to the year. As is the case with many other markets, the key to investing in crypto asset markets is cutting through the noise to develop a truer understanding of market fundamentals. Throughout this article, we have demonstrated that crypto asset adoption rates have been affected by market conditions, but largely remain healthy. For this reason, and our long term conviction in this breakthrough technology, we remain as bullish on crypto assets as ever. To that end, in the Apollo Capital Fund, we are cautiously rotating out of cash and yield farming positions and gradually deploying into long positions in high conviction assets.
Sources for this article: https://defillama.com/, https://glassnode.com/, https://messari.io/
David Angliss
David is an analyst at Apollo Crypto with five years of crypto-asset investing experience. He contributes to the investment team by researching crypto-assets across the innovative contract platform, DeFi assets and NFT and Metaverse infrastructure categories. David also assists with the day-to-day activities of market-neutral strategies by analysing yields, evaluating smart audits, and facilitating crypto-asset transactions.