categories
All Categories
- Bitcoin
- Centralised Exchanges
- Crypto
- Crypto Asset Volatility
- Crypto Correlations
- Crypto Governance
- Crypto in the Portfolio
- Crypto Valuations
- DeFi
- ESG
- Ethereum
- Investment Highlight
- Regulation
- Security and Privacy
- Social Media Influence
- Stable Coins
- Traditional Finance and Crypto
- Uncategorized
- UNSDG
- Web 3.0
Authors
All Authors
Thoughts On Valuing Crypto Assets
by Matthew Harcourt
Introduction
Valuation of crypto assets is an evolving field. The article below presents and discusses some valuation techniques applicable to crypto assets including Smart Contracts Platforms, DeFi Assets and NFT Infrastructure.
This article will not focus on the valuation of Bitcoin and instead focus on cash-backed assets. Bitcoin’s value is mostly derived from its monetary utility, it is more useful to compare Bitcoin to traditional assets like gold rather than other crypto assets. Absolute valuation metrics like P/E ratios (Price-to-Earnings) and revenue sharing characteristics are available for some crypto assets, usually “cash-backed” DeFi assets. It is important to note that the Apollo portfolios are not built solely based on these valuation methods. The Investments Team will consider these metrics and valuation methodologies while also having a strong emphasis on qualitative factors such as; the level of innovation, competitive advantages, the calibre of the team and likely community adoption.
Smart Contract Platforms
Smart contract platforms such as Ethereum (ETH), Solana (SOL) and Avalanche (AVAX) are some of the top performing investments in the Apollo Capital Fund. Comparing the relative valuations of these networks can be informative in portfolio construction.
We look at on-chain transaction fees when valuing an asset such as Ethereum which use these to pay miners and token holders through its burn mechanism. Much like the “cash-backed” DeFi assets (covered below), holders of ETH directly benefit from the transaction fees spent on the network through EIP 1559’s ‘burn mechanism’. Below is a relative analysis of various smart contract platforms, comparing fees and other statistics.
Relevant Metrics for Q2 of 2022
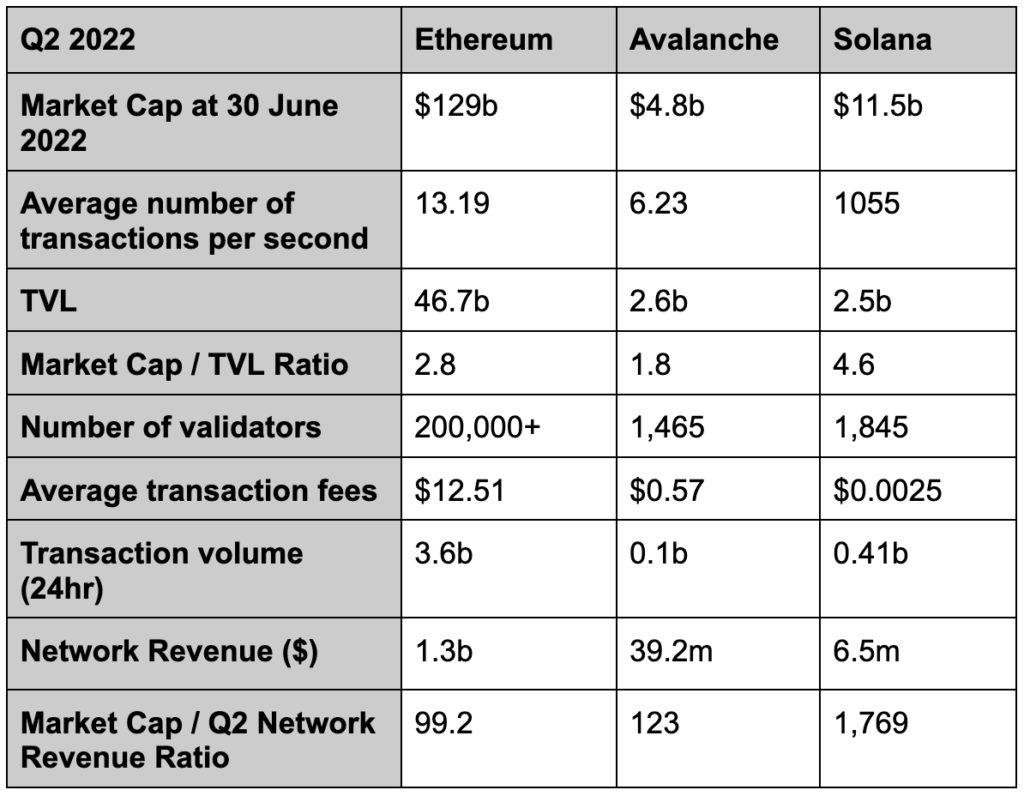
https://messari.io/
We can make a number of observations from this data set:
- Ethereum is the most decentralised smart contract platform based on the higher number of network validators compared to that of Solana or Avalanche. However, Solana uses a more centralised approach to improve speed and performance, as evident in its high transaction speed and low transaction cost.
- Ethereum, despite having the highest market cap, is the clear frontrunner on a relative value basis. Ethereum has the lowest Market Cap / Network Revenue calculation, as well as the second lowest Market Cap / TVL ratio.
- We could argue that Solana has the highest future growth priced in. Solana has the highest Market Cap / TVL ratio and a very high Market Cap / Network Revenue ratio.
- While these metrics help support a bullish case for Ethereum relative to Avalanche and Solana, they do not provide any guidance on whether Ethereum has reached its fair value or whether there is still potential upside.
Cash Flow Assets
“Cash-backed” crypto assets can be valued with more traditional methods such as a PE ratio. Just as a company’s share price is a function of its future earnings, a “cash-backed” crypto asset may be a function of future cash flows accruing to the token. Not all crypto or DeFi assets are currently backed by cash flows, valuations of these assets may be derived from future expectations of cash flows. As crypto assets are high growth assets, the market generally gives them high PE ratios.
UniSwap (UNI), LooksRare (LOOKS), and GMX (GMX) are a few of Apollo’s top decentralised protocol investments. Both Uniswap and LooksRare are built on the Ethereum network, whilst GMX is built on Abritrum/Avalanche. UniSwap is the largest decentralised exchange (DEX) in the DeFi sector, LooksRare is a unique NFT marketplace, and GMX is a decentralised spot and perpetual exchange. We can look at traditional financial metrics when valuing these assets.
UniSwap (UNI)
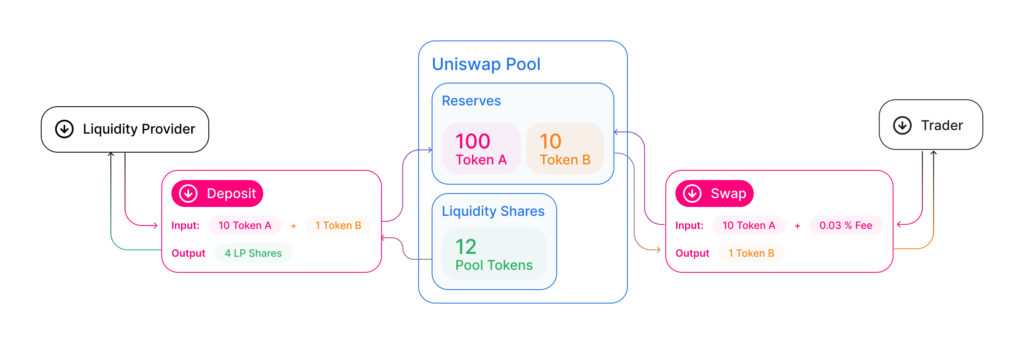
- This diagram shows the current trading model of UniSwap.
- While there are various fee tiers for different types of trading pairs, the above diagram shows the 0.03% transaction fee tier, this is used for stablecoin trading pairs. Other fee tiers include 0.05%, 0.1% & 0.3%.
Uniswap does not currently distribute revenue to their token holders. Rather, revenue from transaction fees are distributed to the liquidity providers on their exchange. However, it is widely accepted that Uniswap will eventually adopt a revenue sharing model. If they decide to distribute part of the protocol revenue to token holders, we can calculate the P/E values below:
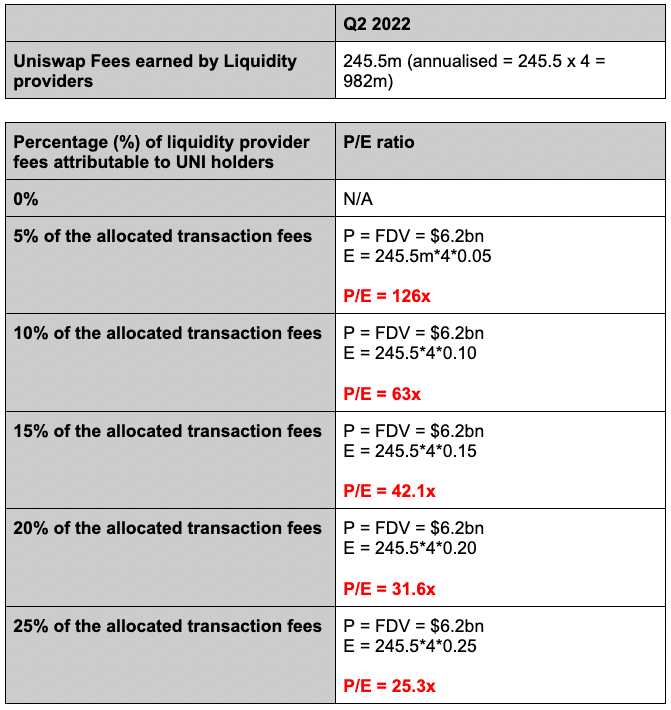
- The P/E is determined by how much UNI token holders will receive of the total fees accrued to liquidity providers.
- Our view is that Uni holders will receive roughly the same amount as what SushiSwap holders receive, which is 16.6% of the transaction fees, suggesting UNI tokens are trading on a PE of approximately 38.
GMX
GMX is one of Apollo’s most recent and exciting investments. GMX is a decentralised spot and perpetual exchange available on Arbitrum and Avalanche. GMX is a great example of protocol revenue sharing with token holders. GMX has two fundamentally different tokens, the GMX token and the GLP token. The GMX token is the platform’s utility, staking and governance token, whereas the GLP is the liquidity provider token that consists of a basket of crypto assets.
Users who stake GMX share 30% of the protocol revenue (trading fees) including emissions (esGMX – vested GMX token), whilst the GLP token holders earn 70% of the protocol revenue. It is important to note that the fees generated by GMX are organic and are paid in AVAX and ETH. Since launching on Arbitrum on 31 August 2021 and Avalanche on 6 January 2022, the exchange has reached total volume of $36b and $12b on each chain respectively – cumulative total volume amounting to over $48b.
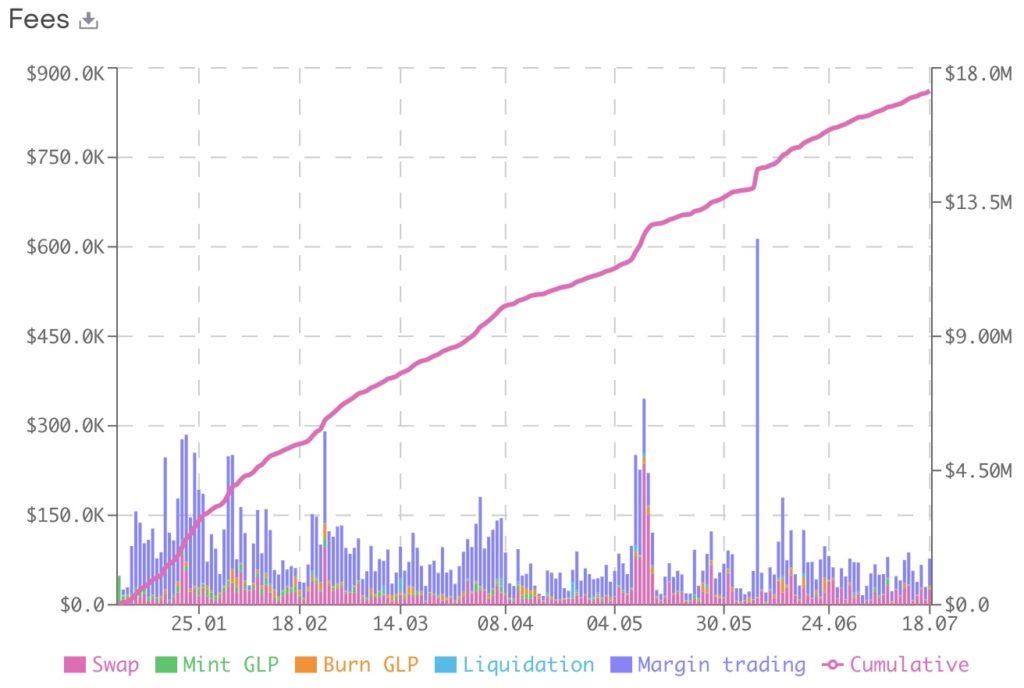
When determining the underlying value of GMX, we look at the trading volume and trading fees/revenue distributed to the token holders. The GMX protocol generates revenue by charging fees on the opening and closing of trades, including a “borrow fee” which is distributed entirely to token holders. A total of 48 million in fees has been distributed amongst token holders on the Arbitrum chain and over 17 million on the Avalanche chain.
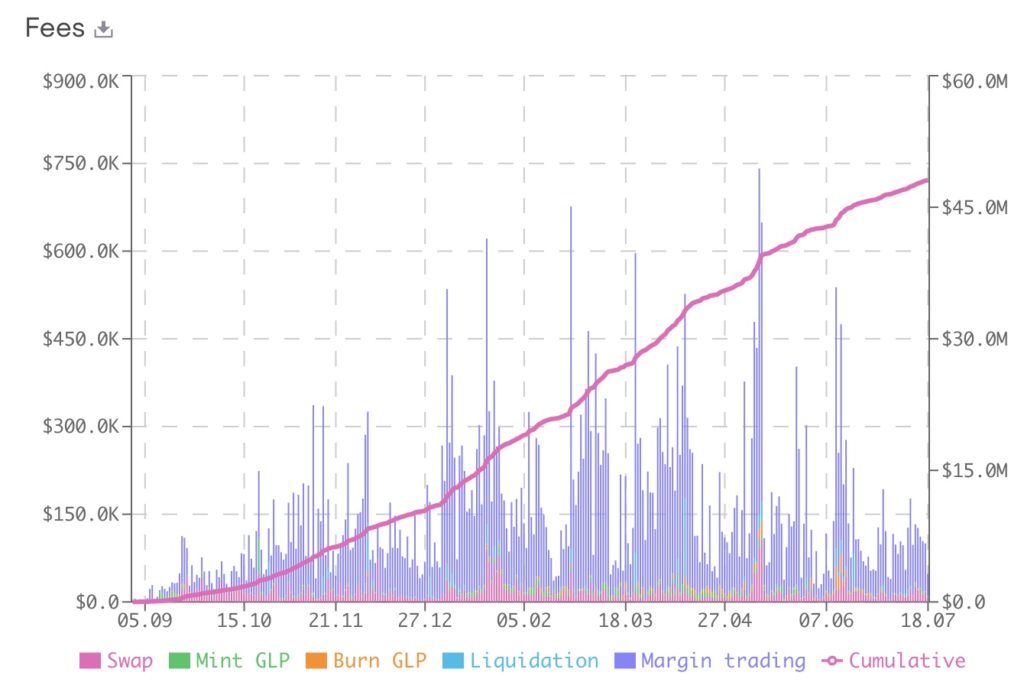
Cumulative GMX Fees on Avalanche ($US)
https://stats.gmx.io/
Cumulative GMX Fees on Arbitrum ($US)
https://stats.gmx.io/
The transaction fees generated on the Arbitrum network, comes to a predicted annualised revenue of 56.6m (https://stats.gmx.io/). Using this value we can calculate the GMX holders earnings on the Abritrum chain.
- GMX holders earn 30% of 56.6 = 17m
If we look at the total fee generation since the 6th of Jan (when GMX launched on Avalanche), we see it is currently 17.8m (https://stats.gmx.io/). The annualised revenue generated from the Avalanche platform fees is approximately $28.5 million. Using this value we can calculate the GMX holders earnings on the Avalanche chain.
- GMX holders earn 30% of 27.6 = 8.55m
The P/E calculation is as of 31/07 as follows:
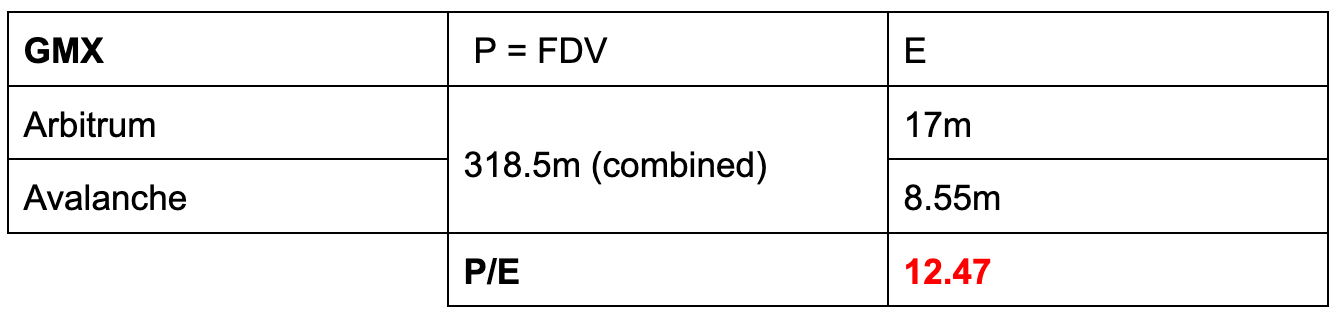
This a relatively low P/E ratio, which means buying $GMX is equivalent to acquiring a cash flow at a low price. In the graph below we see that there was a large decrease in the P/E ratio between September and October 2021, which is due to the large increase in the number of users and fees generated by GMX.
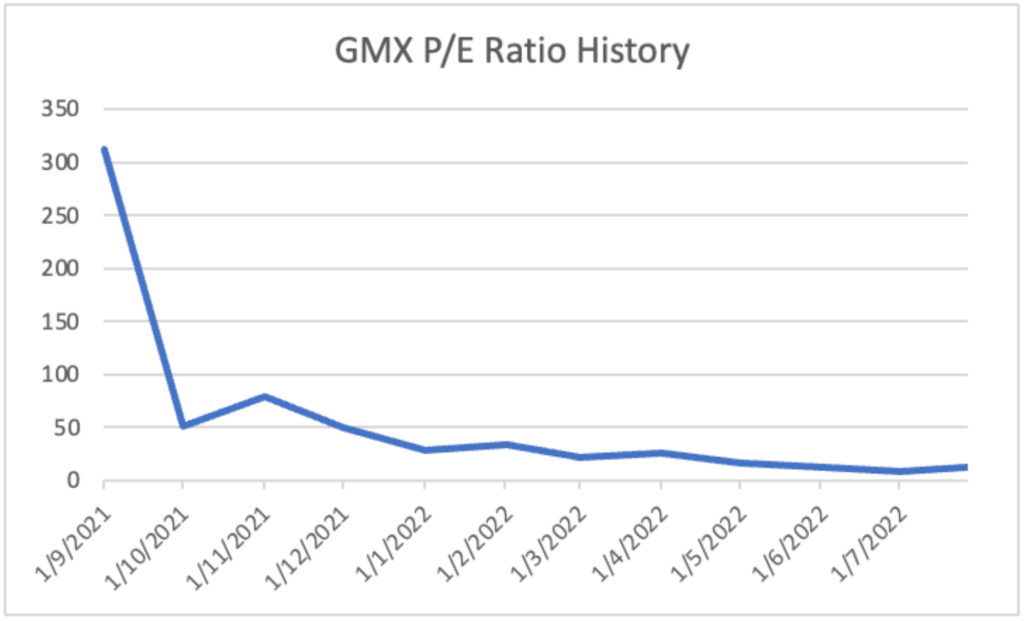
Source: Apollo Capital
LOOKSRARE
LooksRare (LOOKS) is a decentralised NFT marketplace that actively rewards its users for interacting and participating on their market. LooksRare generates revenue from platform transaction fees, in which 100% of these fees are earned by LOOKS token stakers. This feature sets them apart from all other NFT marketplaces and is a key reason why we see great value in the protocol.Furthermore, users are incentivised to buy and sell NFTs on LooksRare as they earn LOOKS tokens as rewards. LooksRare collects a sales fee of 2% on all NFT sales excluding private sales. Investors that stake the LOOKS token earn 100% of the trading fees on LooksRare.
The Total transaction value on LooksRares NFT Marketplace since launching on January 10 2022, is approximately 1.57b, equating to an annualised volume of roughly 3.1b.
- 2% of the 3.1b trading volume is earned by token stakers.
- This is equivalent to 62m
The P/E calculation is as follows:
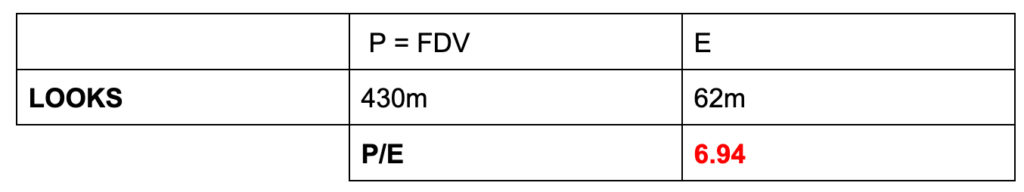
This a low P/E ratio, which makes the LOOKS token more attractive because the token prices trade lower relative to the revenue growth and token fundamentals.
Conclusion
At Apollo Capital, in addition to qualitative factors, we use a combination of relative and absolute valuation methodologies when assessing crypto projects and rebalancing portfolios. Despite still being in the infant stages, we continue to look at different valuation techniques that may offer extra help in our investment choices. Despite crypto assets being broadly viewed as providing investors with hyper growth exposure, we can see that some crypto assets trade at extremely attractive Price/Earning multiples. We believe it is essential to look at this information combined with technical knowledge of how crypto assets operate, accrue value and grow in utility and community adoption.
Matthew Harcourt
Matthew has been actively investing in the crypto markets for 7 years and holds a Bachelor of Business from Monash University, majoring in Accounting. Matthew focuses on portfolio construction through thorough research and analysis of crypto protocols as well as execution of investments and strategies. Matthew’s passion lies in supporting portfolio companies through advisory on tokenomics and strategy, adding significant value to Apollo Crypto’s early-stage investments.