
categories
All Categories
- Bitcoin
- Centralised Exchanges
- Crypto
- Crypto Asset Volatility
- Crypto Correlations
- Crypto Governance
- Crypto in the Portfolio
- Crypto Valuations
- DeFi
- ESG
- Ethereum
- Investment Highlight
- Regulation
- Security and Privacy
- Social Media Influence
- Stable Coins
- Traditional Finance and Crypto
- Uncategorized
- UNSDG
- Web 3.0
Authors
All Authors

Fear at 12, Cash Flows Intact
by Quinn Papworth
Bitcoin has fallen about 20% in two weeks and the Crypto Fear & Greed Index is at 12, one of its lowest readings on record. In this note we look at why the selling happened and why we think the longer-term case for the asset class, particularly for tokens that return revenue to holders, is intact.
This blog covers:
- The macro backdrop: a hawkish Fed, a strong US dollar and the Nvidia leadership shock
- Bitcoin: why the recent selling looks forced, and what has followed past readings this low
- Crypto businesses: how much revenue protocols earn and how much of it now reaches tokenholders
- Market pricing: why tokens that pay holders have outperformed this year and how they are valued
Macro: a risk-off week with a clear cause
The Federal Reserve raised rates in September and held the target range at 3.75% to 4.00% in October, with two officials voting for another increase. Inflation is still above 3%, and as of 13 November CME FedWatch priced roughly a 90% chance of a December hike. The 10-year Treasury yield closed that week at 5.15% and the US dollar index at a 19-month high of 103.41.
The second shock came from equities. Jensen Huang resigned as Nvidia’s chief executive on 12 November, and the stock is down about 30% from its 6 October peak, a loss of roughly US$1.7 trillion in market value. As the centre of the AI trade, Nvidia’s fall weighed on risk appetite more broadly.
Three releases matter this week. October US retail sales are out at 12:30am AEDT on Wednesday 18 November (consensus +0.2%), Nvidia reports at about 8:20am AEDT the same day, and the October FOMC minutes follow at 6am AEDT on Thursday 19 November.
Much of this is already priced. A December hike is close to fully expected, and crypto has fallen further than equities: bitcoin dropped 8.7% over the US trading week of 9 to 13 November while the S&P 500 rose 2.5%. Most of that loss came outside US market hours, which points to thin liquidity and leveraged positioning rather than a broad change in investor views.
Bitcoin: forced sellers
Bitcoin traded at about US$64,500 on 17 November, 48.9% below its all-time high of US$126,080 set on 6 October 2025. It fell from US$80,500 on 4 November to a weekend low near US$62,100 on 15 November. Several measures suggest the selling was forced:
- Liquidations. CoinGlass recorded about US$1.6bn of liquidations in the 24 hours to 13 November and close to US$2bn in the 24 hours to 15 November, around 90% of them long positions.
- Open interest. Open interest on Binance’s BTCUSDT perpetual fell 22%, from US$7.74bn on 5 November to US$6.00bn on 17 November.
- Funding. Funding rates fell from the 0.01% per eight hours default to slightly negative on 16 and 17 November, meaning more traders are now paying to be short.
- ETF redemptions. US spot bitcoin ETFs saw outflows of US$1.28bn and US$1.07bn in the first two weeks of November, although cumulative net inflows since launch remain about US$54.7bn.
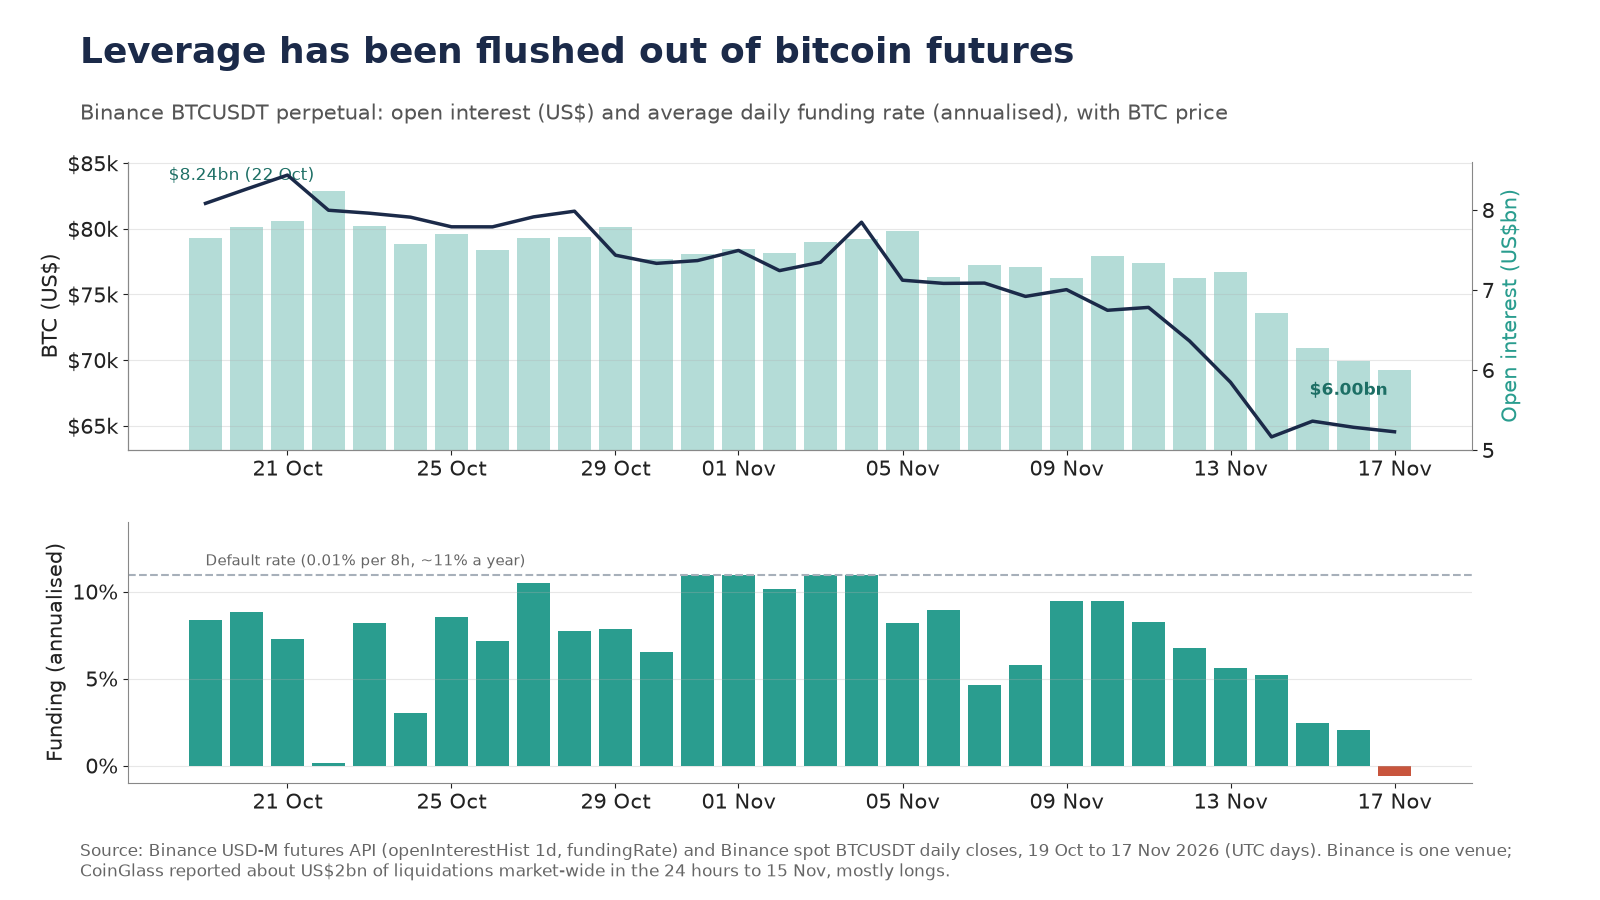 Figure 1. Binance BTCUSDT perpetual open interest and daily funding (annualised), with BTC price, 19 October to 17 November 2026. Sources: Binance futures and spot APIs; liquidation totals from CoinGlass as reported by CoinDesk and Decrypt, 13–15 November 2026.
Once leverage has been cleared this quickly, fewer holders are left who can be forced to sell on the next move down. We also tested whether sentiment this weak has marked good entry points. Since 2018 there have been 19 separate episodes in which the Fear & Greed Index fell to 12 or below. Bitcoin was higher 30 days later in 68% of them, with a median gain of 5.2%.. The 90-day median was 8.8%. Beyond six months the signal fades, and the 12-month median was negative because several episodes, including November 2025, came early in a longer downturn.
The size of the drawdown has been a better long-term guide. On days when bitcoin was 45% or more below its previous high, the median return over the following year was 85%, and 86% of those days were followed by a higher price 12 months later. These days come mainly from three cycles (2018–19, 2020 and 2022–23), so the sample is smaller than it looks and thereby somewhat dubious. Bitcoin is now 48% below its closing high.
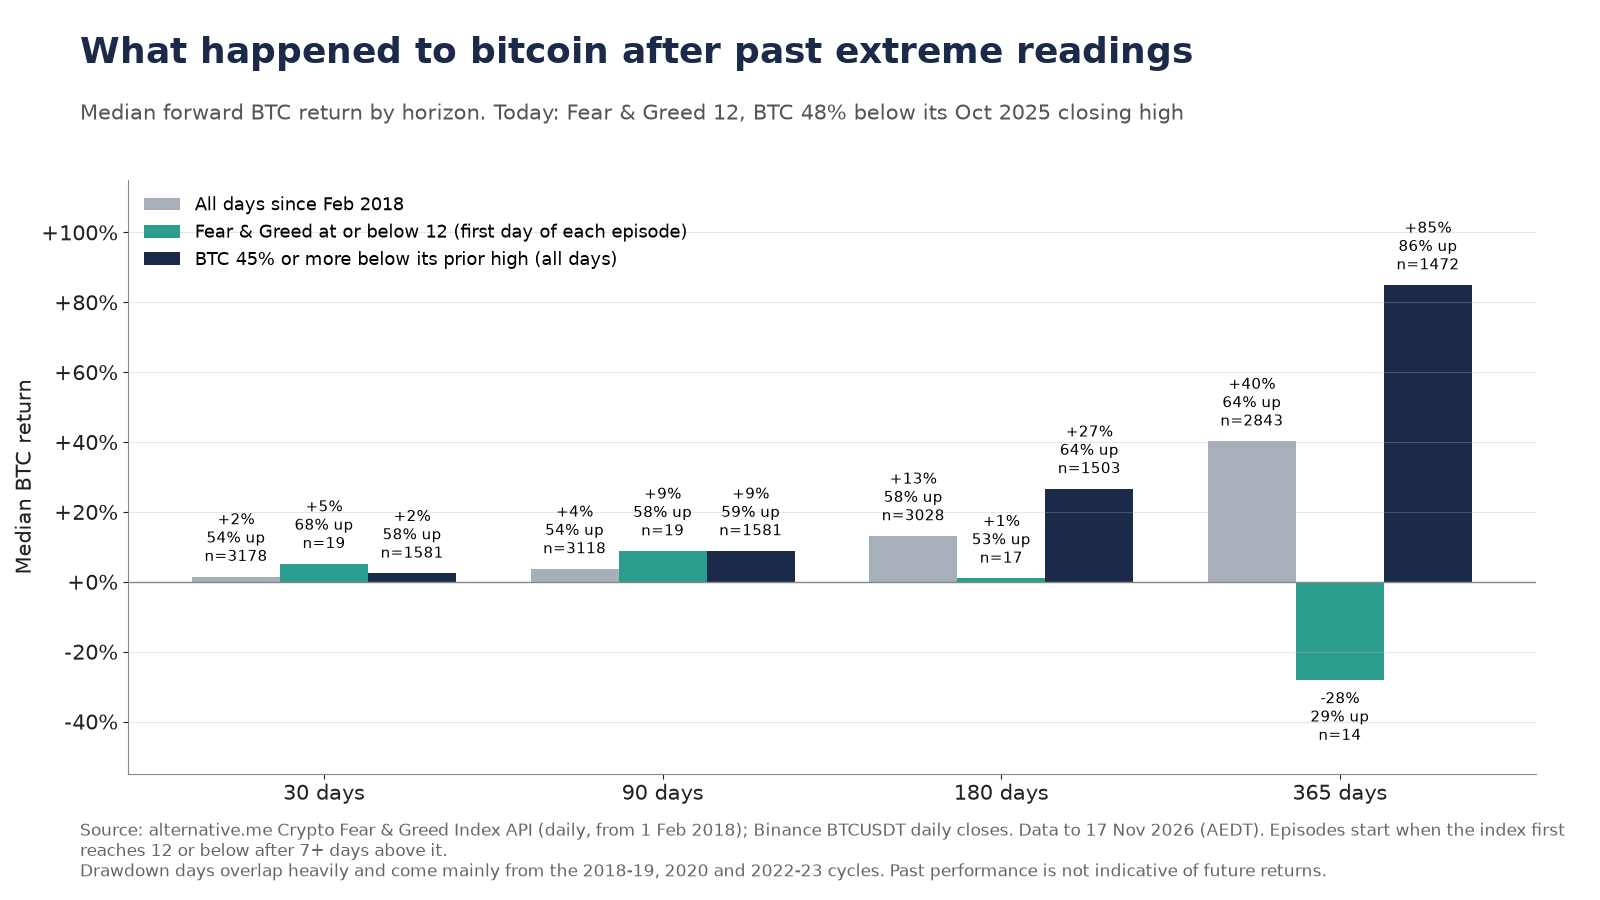 Figure 2. Median forward bitcoin returns after extreme Fear & Greed readings and deep drawdowns, February 2018 to 17 November 2026. Sources: alternative.me Fear & Greed Index API; Binance BTCUSDT daily closes. Past performance is not indicative of future returns.
In our view, extreme fear supports a near-term recovery and the depth of the drawdown supports accumulating over a 12-month horizon. Neither tells us exactly where the low will be however.
Crypto businesses are paying tokenholders
Crypto revenue has fallen with prices this year, but it remains large. 1kx’s 2026 revenue report estimates that blockchain revenue fell 28% year on year, broadly in line with the 30% decline in crypto prices, and is still expected to reach about US$100bn in 2026. Relative to total crypto market capitalisation, 1kx finds revenue flat year on year, and it notes that revenue rose again in Q3 compared with Q2.
The more important trend for token investors is how much of that revenue is passed on. According to 1kx, a record 283 protocols were distributing value to tokenholders in Q3 2026, and the distribution rate, measured as the ratio to fees, hit a new high in 2026. Applications’ fee distribution also reached a record. 1kx describes the number of protocols monetising as still increasing, with the number distributing value to holders at an all-time high.
Monthly payouts tracked by DefiLlama have also picked up after a quieter first half. Holders revenue (buybacks, burns and distributions) reached US$240m in October 2026, its highest monthly total since October 2025. Lighter, UNI, Lido and NEAR Intents were among the protocols that began passing meaningful revenue to holders this year.
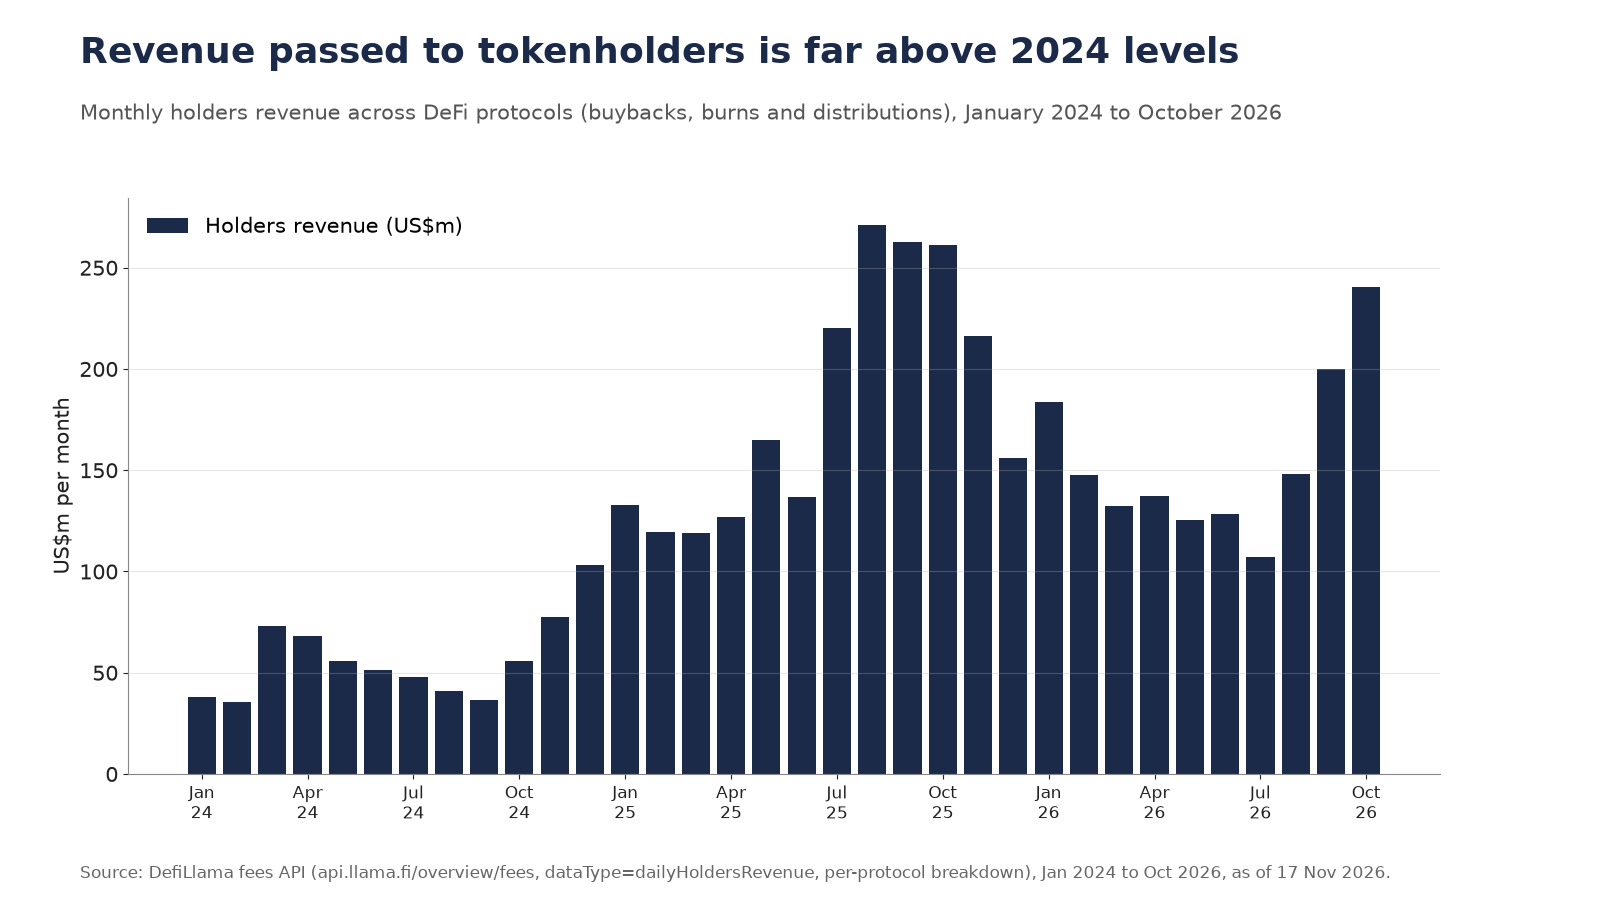 Figure 3. Monthly holders revenue across DeFi protocols, January 2024 to October 2026. Source: DefiLlama fees API, as of 17 November 2026.
Buybacks are now a regular part of the market. Token Buybacks counted 37 active programs and US$138m of buybacks in the 30 days to 15 November. Hyperliquid accounted for about half of that (US$70.4m), followed by Pump.fun (US$20.3m), Uniswap (US$8.1m) and Sky (US$5.5m). Uniswap’s fee switch has sent US$64.8m to holders this year, according to DefiLlama. Not every program is active: Aave’s buyback has been idle since April.
Some parts of the market have held up well despite lower prices. 1kx reports that perps fees rose 14% year on year as markets for real-world assets reduced their dependence on crypto prices. Real-world asset markets made up 18% of all perpetual volume in Q3, with an estimated US$1bn in trading fees in the first half of 2026. Hyperliquid has led perp DEXs by fees for close to two years, with a 54% share of perps fees, and 1kx notes it earned US$939m in trailing 12-month fees without raising outside funds.
Fees are concentrated among the leaders. According to 1kx, the top 20 protocols account for 60% of onchain user-paid fees, and 30 protocols are on track to earn more than US$100m in onchain fees in 2026. Leadership in each sector tends to rotate over time, which is a reason to keep reviewing which protocols are earning and distributing.
The market is rewarding tokens that pay holders
This year, returns have followed payouts. 1kx analysed more than 60 factors affecting token performance between 2021 and 2026 and found that value distributed to holders was the strongest driver of outperformance against other tokens. Its dividend-token index returned 82% from 1 January to 30 September 2026, and an equal-weighted group of dividend payers returned 49%. Over the same period bitcoin returned -5% and the CMC100 excluding bitcoin returned -7%. 1kx notes that outperforming bitcoin had been rare in recent years until 2026.
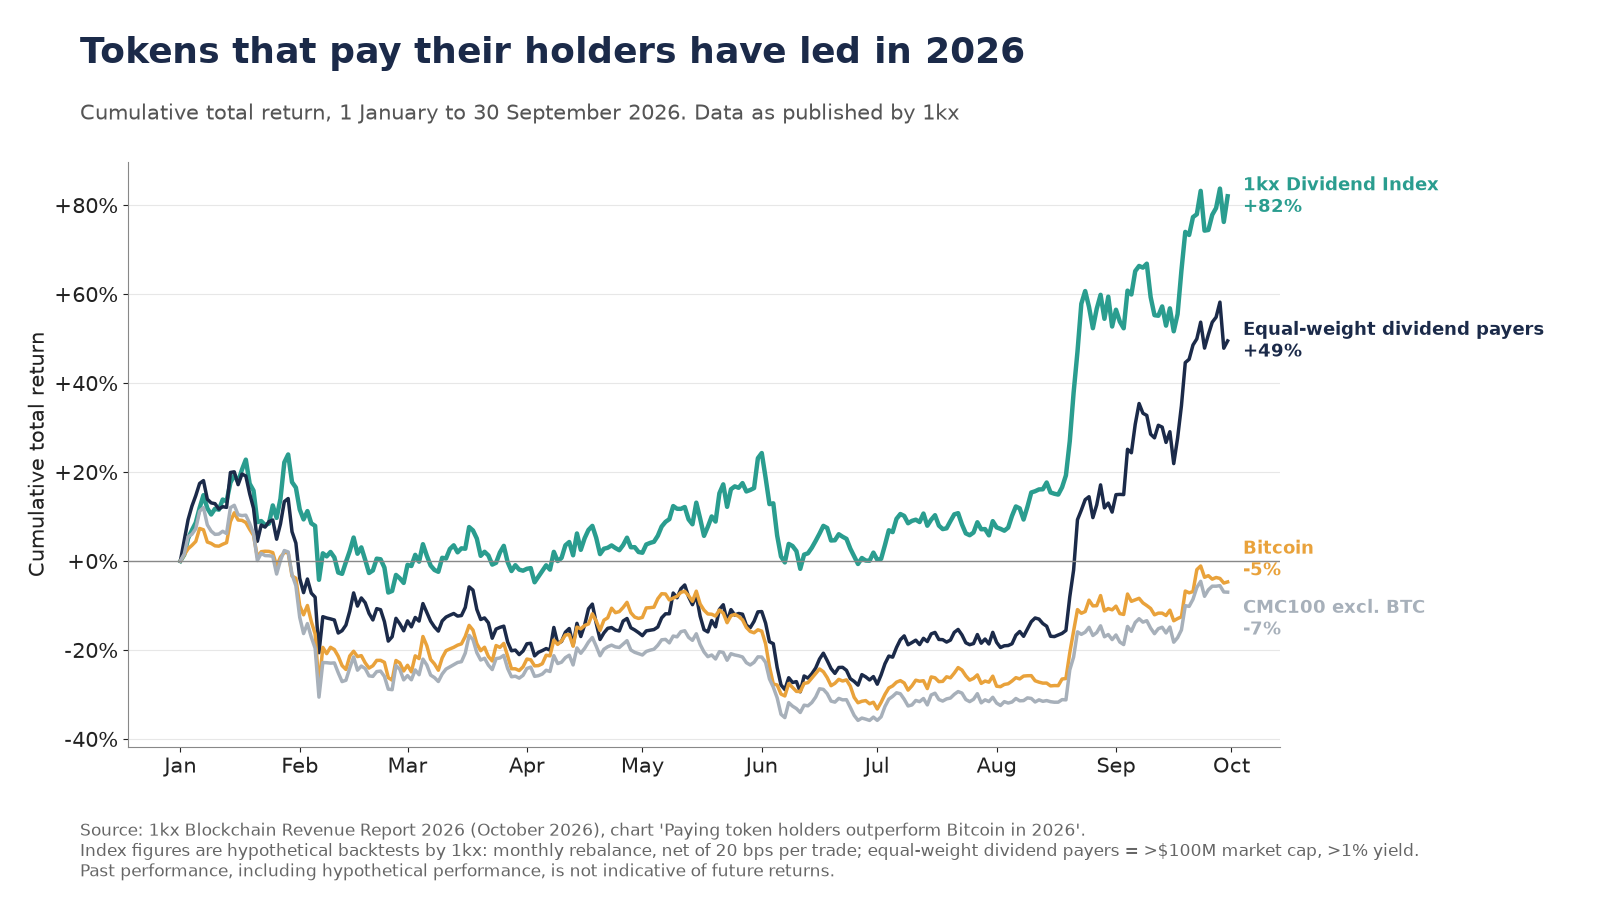 Figure 4. Cumulative total return of the 1kx Fundamentals Index Dividend, equal-weight dividend payers, bitcoin and the CMC100 excluding bitcoin, 1 January to 30 September 2026. Source: 1kx Blockchain Revenue Report 2026 (October 2026). Index figures are hypothetical backtests (monthly rebalance, net of 20 bps per trade). Past performance, including hypothetical performance, is not indicative of future returns.
Valuations for these tokens remain grounded in their cash flows. 1kx’s Q3 2026 figures put value-distributing DeFi protocols at a median of 8x price to fees, compared with 18x for all DeFi/Finance protocols and 6x for public exchanges and brokers. Consumer protocols trade at 6-10x on all multiples, reflecting the high share of fees passed to holders. Blockchain infrastructure is the exception, at around 2,000x price to fees. In our view, this leaves room for revenue-sharing applications to rerate as fees recover, without relying on the premium that base-layer tokens carry.
1kx expects blockchain revenue to recover in the coming quarters as institutional and broader economy use grows, which it estimates already accounts for 30% of revenue in 2026.
Risks
A December hike or stronger inflation could keep pressure on risk assets for longer, and ETF outflows have not yet reversed. Sentiment indicators are not timing tools, and the 12-month record after extreme fear readings is mixed. Crypto fees are below last year’s levels, this year’s outperformance has been concentrated in a few tokens, and buyback programs can be paused, as Aave’s has been since April.
Conclusion
The November sell-off was driven by tighter monetary conditions and an equity shock, then amplified by leveraged positions being closed. Leverage has since been reduced, sentiment is near historical lows, and bitcoin is close to 50% below its peak, a level that has previously been followed by strong 12-month returns. Beneath the price moves, blockchain revenue is on track for about US$100bn this year, a record number of protocols are returning value to holders, and the market has rewarded those that do. We see the current weakness as an opportunity to potentially add exposure to bitcoin and to protocols that share their revenue with tokenholders.
Past performance is not indicative of future returns.

Quinn Papworth
Quinn holds a Bachelor of Business from RMIT, majoring in Finance & Blockchain Enabled Business and has 4 years experience actively investing in crypto markets. Quinn is an analyst at Apollo Crypto and is deeply passionate about producing accessible crypto research content to help educate and onboard users.