categories
All Categories
- Bitcoin
- Centralised Exchanges
- Crypto
- Crypto Asset Volatility
- Crypto Correlations
- Crypto Governance
- Crypto in the Portfolio
- Crypto Valuations
- DeFi
- ESG
- Ethereum
- Investment Highlight
- Regulation
- Security and Privacy
- Social Media Influence
- Stable Coins
- Traditional Finance and Crypto
- Uncategorized
- UNSDG
- Web 3.0
Authors
All Authors

Is Bitcoin at a Turning Point?
by Quinn Papworth
For much of the past year, the case for Bitcoin as “digital gold” has looked like an exercise in branding rather than reality. While Gold surged to record highs above $5,000 an ounce on the back of central-bank buying and geopolitical anxiety, Bitcoin drifted lower—from near $109,000 in late 2024 to the mid-$60,000s by early 2026. The narrative of a decoupling was, for a while, painfully literal: gold up, Bitcoin down. But something has shifted in recent weeks. A cluster of signals—from the ratio between the two assets, to the behaviour of the world’s most aggressive corporate buyer, to the mood of retail investors—suggests that the balance of forces in the Bitcoin market may be tilting.
The ratio tells the story
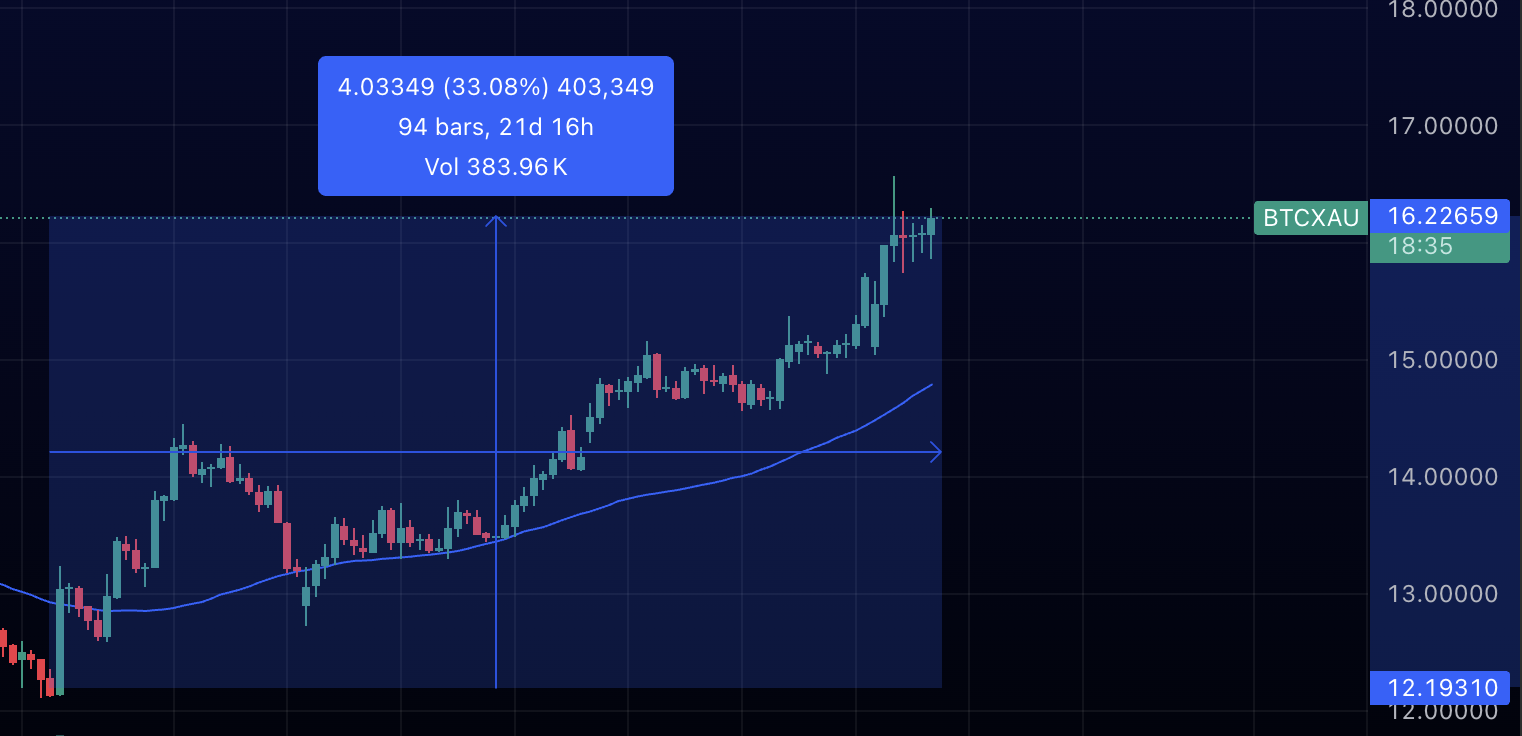
The cleanest way to measure Bitcoin’s performance against its analogue rival is the BTC/GLD ratio—the price of one Bitcoin divided by the price of one ounce of gold. After months of decline, the ratio has risen roughly 33% since the start of March. That is a meaningful swing in a single month, and it has caught the attention of cross-asset strategists who track regime changes in relative value.
What makes this move particularly striking is the macro backdrop against which it is occurring. The world is in a distinctly “risk-off” phase. The Strait of Hormuz crisis has sent Brent crude above $120 a barrel. Asian equities are nearing correction territory. Gold, until recently, had been the consensus haven trade. Yet it is now gold that is faltering—suffering its longest losing streak in years, dropping for nine consecutive sessions to around $4,360 an ounce—while Bitcoin has held above key support near $66,000 and outperformed most traditional assets during the selloff.
The divergence is not easily explained by traditional models. One interpretation, offered by Alexander Blume of Two Prime, an SEC-registered investment adviser, is structural. Central banks, particularly China’s, had been systematically buying gold as part of a broader effort to decouple from Western markets and the dollar. That buying has reversed as the geopolitical crisis has intensified and liquidity has become the priority. Bitcoin, unburdened by official-sector positioning, has proved more resilient. Its derivatives markets have held up surprisingly well. The BTC/GLD chart, in short, is beginning to tell a story of rotation.
Saylor’s refinery
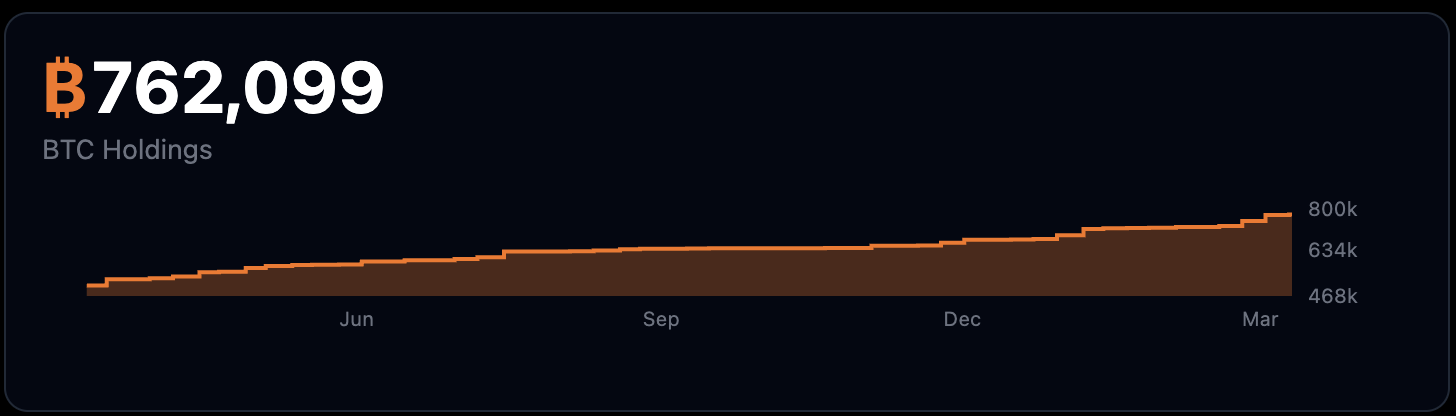
If the ratio is the thermometer, Michael Saylor’s Strategy (formerly MicroStrategy) is the furnace. On March 23rd, Strategy announced a fresh $42 billion at-the-market capital raise—split evenly between $21 billion in common stock and $21 billion in its STRC perpetual preferred shares. The scale is incredible and could see Saylor achieve the 1 million in BTC holdings mark. As of the same date, the firm holds 762,099 Bitcoin, acquired for a total of $57.69 billion at an average cost of roughly $75,694 per coin. That represents more than 3% of Bitcoin’s total 21 million supply.
The instrument at the centre of this latest campaign deserves close attention. STRC—Strategy’s Variable Rate Series A Perpetual Stretch Preferred Stock—is an unusual beast in capital markets. It pays an 11.5% annual dividend, distributed monthly in cash, and is engineered to trade near its $100 par value with low volatility. Since its launch in July 2025, it has recently started to become one of the most liquid preferred equity instruments on the Nasdaq.
The genius of the structure—is that it transforms yield hunger into Bitcoin accumulation. Traditional fixed-income investors, attracted by the high coupon and relative price stability, pour capital into STRC. Strategy then channels the proceeds directly into Bitcoin purchases. During the week of March 9th–15th alone, the firm raised $1.18 billion through STRC issuance and used the proceeds to acquire 22,337 Bitcoin, its fifth-largest weekly haul on record. On March 12th, a single trading session generated enough STRC proceeds to buy more than 4,000 coins.
This is not, as some critics suggest, an act of desperation. It is a confidence trade at these prices. Strategy’s annualised dividend obligations on its preferred stock now exceed $1 billion, a burden supported by a $2.25 billion cash reserve that its CFO, Andrew Kang, says provides roughly two-and-a-half years of dividend and interest coverage. The firm has described its capital structure as “stronger and more resilient than ever before.”
Yet the risks are real, and analysts have noted them plainly: Strategy can cut payouts and allow dividends to accrue without triggering a default, shifting stress from the issuer to investors. A prolonged Bitcoin downturn could break the $100 anchor, push STRC below par, and leave holders nursing losses on what many treated as a near-cash product. Yet for now, the market is funding the machine willingly.
The taps are turning back on
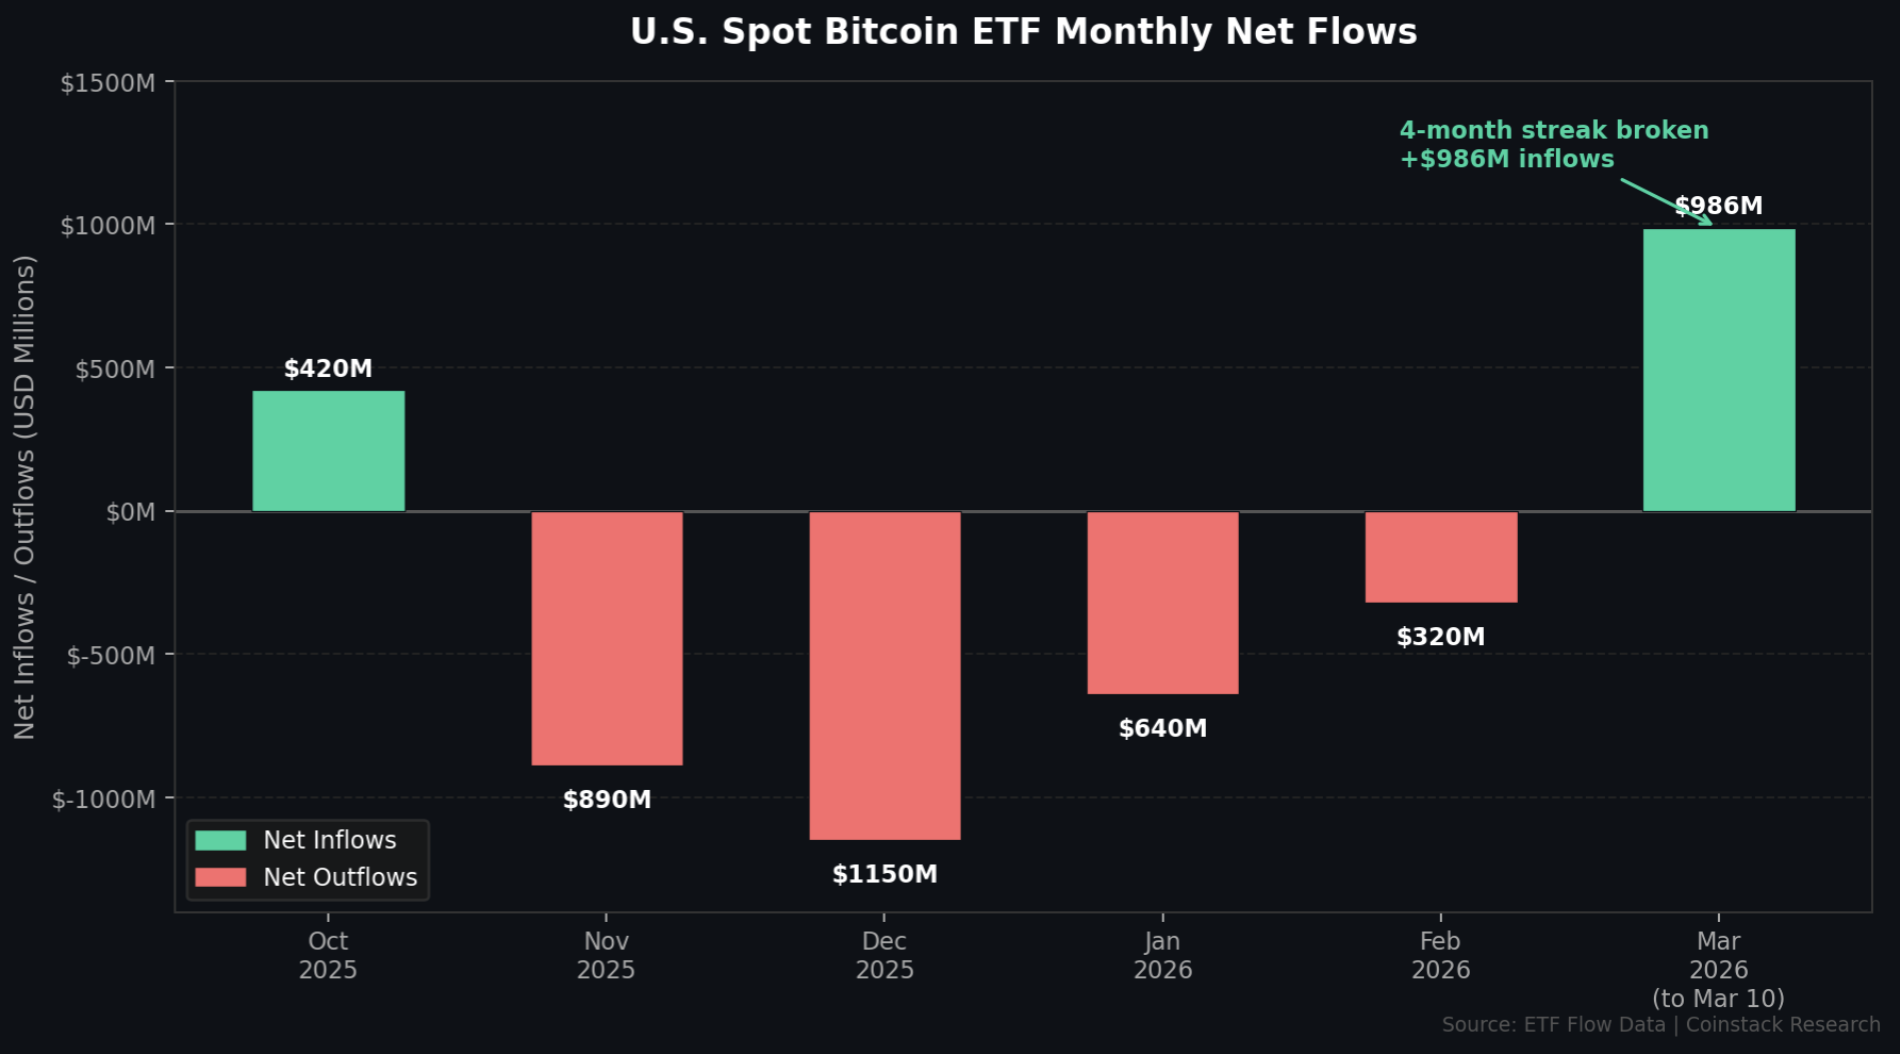
Strategy is not the only source of fresh demand. After months of persistent outflows that saw roughly $9 billion exit US spot Bitcoin ETFs between mid-October 2025 and late February 2026, the picture has reversed. Since February 24th, investors have added approximately $1.7 billion in net inflows to the products. On March 2nd, a single session saw $458 million of net inflows with zero outflows across every listed fund. By mid-March, the category had strung together six consecutive days of positive flows, with BlackRock’s iShares Bitcoin Trust (IBIT) consistently leading the charge.
The nature of the buying matters. Bloomberg Intelligence’s James Seyffart noted that there was “basically no dip buying” when Bitcoin was falling like a stone earlier in the year. Software ETFs, by contrast, attracted record inflows as traders tried to time a bottom in tech. Now that pattern appears to be reversing. The recent ETF flows look less like basis trades and more like straightforward directional bets—a sign that at least some institutional investors believe Bitcoin has found a floor.
Fear as fuel
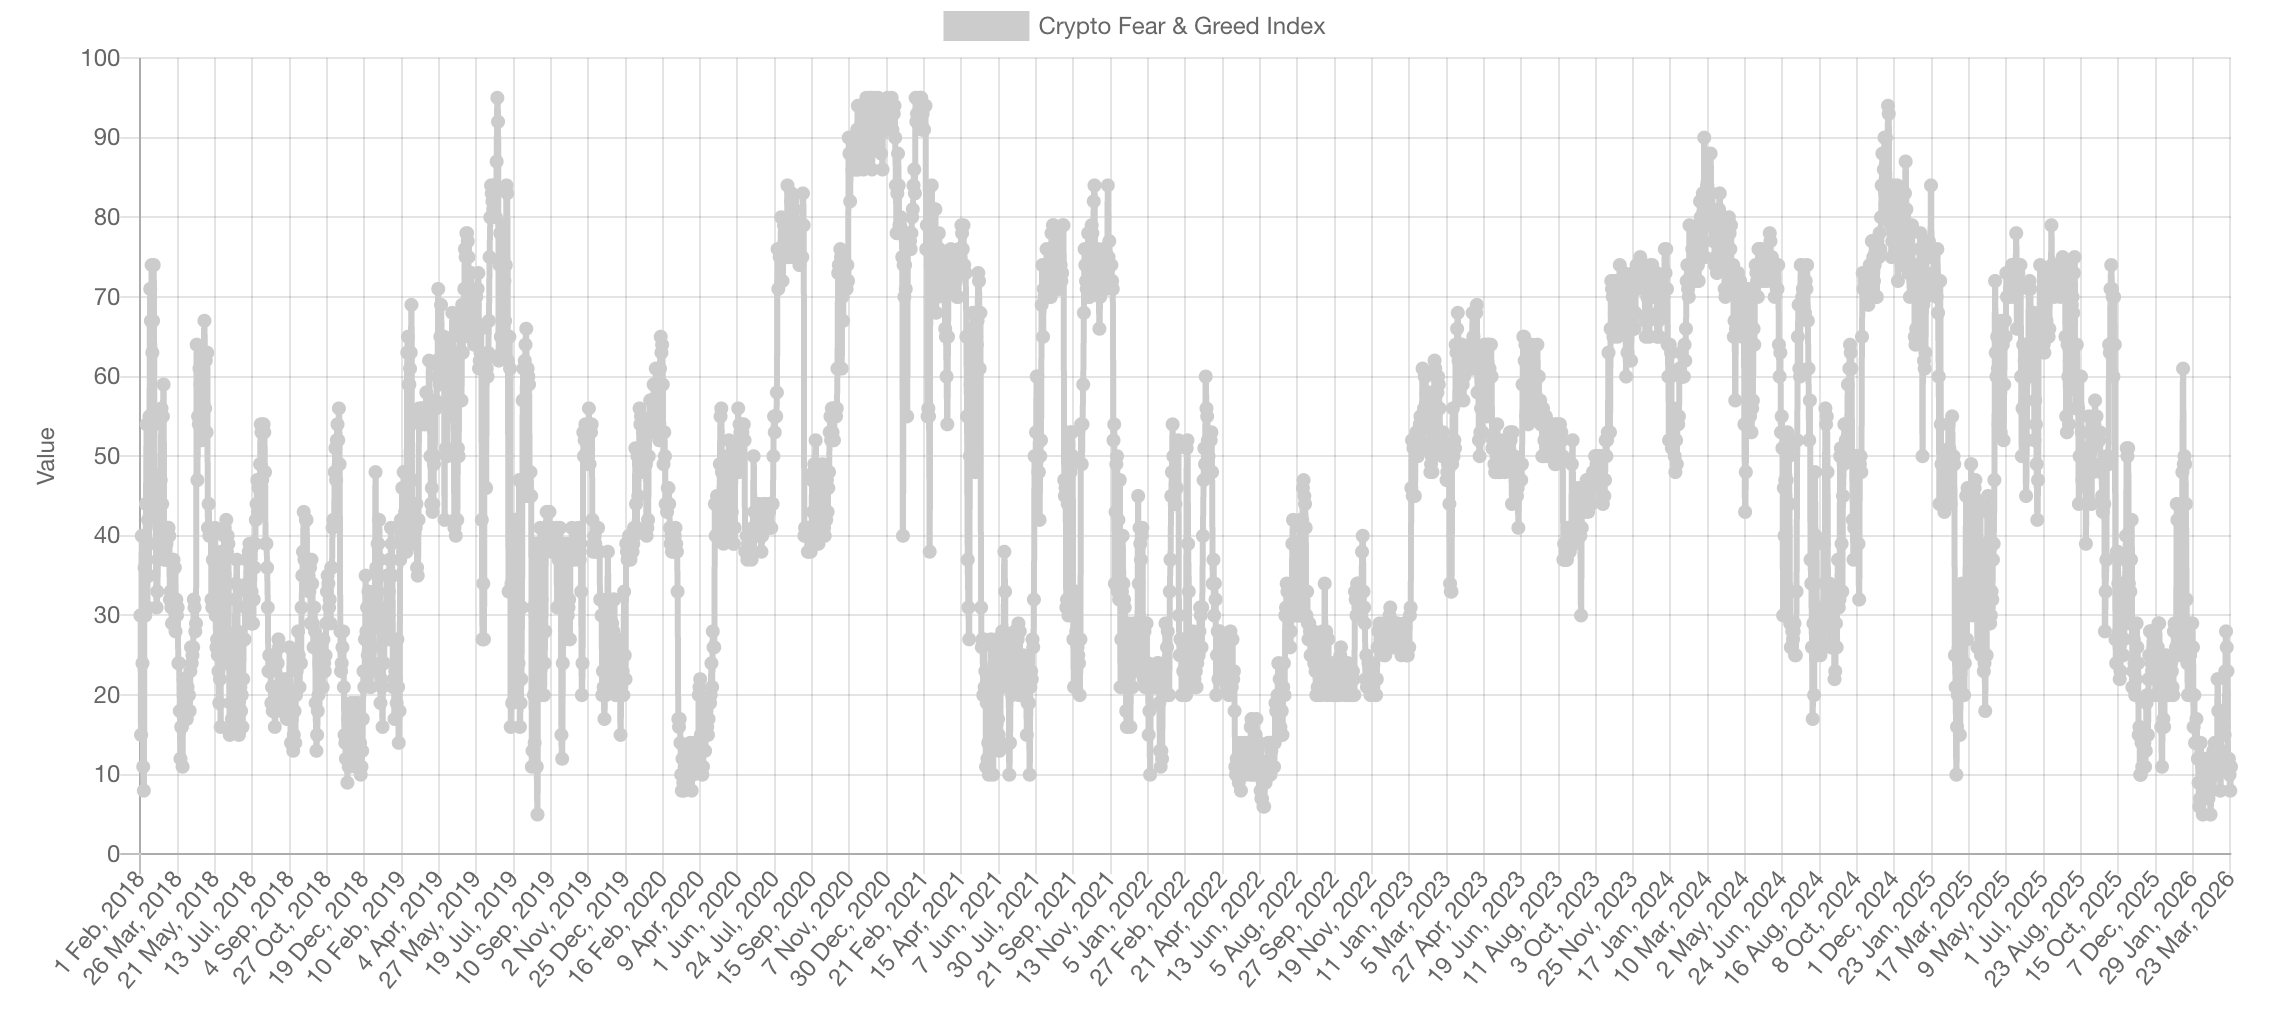
Perhaps the most striking signal is what investors are feeling, or rather what they are not feeling. The Crypto Fear and Greed Index has plunged to levels not seen since the depths of the 2022 bear market. It hit an all-time low of 5 on February 6th—the lowest reading since the index launched in 2018—and has spent 46 consecutive days in “extreme fear” territory, lingering around 10–12 for much of the past month. For context, such readings have previously coincided only with the aftermath of the FTX collapse and the COVID crash of March 2020.
The contrarian implications are significant. According to data compiled by Glassnode, purchasing Bitcoin when the index falls below 15 has historically produced a median 90-day return of approximately 38%. The average 30-day forward return from sub-25 readings has been positive in roughly four out of five instances. These are not guarantees—the 2022 bear market saw additional 40% declines even after extreme fear readings appeared—but they are the kind of statistical skew that attracts capital from systematic and value-oriented funds.
There is another dimension to the fear reading that deserves attention. Much of the crypto market entered 2026 positioned for an alt-season in the fourth quarter of 2025 that never materialised. When it did not arrive, investors rotated aggressively into cash. They are now sitting on that cash, waiting to buy lower—a classic setup for the market to move against the consensus. When you combine this positioning with the re-emergence of potential sustained buying from Strategy, the return of ETF inflows and the improving BTC/GLD ratio, the picture is one of significant potential energy stored in the system.
The other side of the ledger
None of this is without risk. Bitcoin’s 30-day rolling correlation with the S&P 500 stands at 0.55, which means it continues to behave more like a leveraged risk-on asset than a genuine hedge. The 200-day simple moving average sits above $96,000—well above the current price in the high $60,000s—meaning the broader technical structure remains under pressure. The geopolitical backdrop is febrile and unpredictable. A further escalation in the Middle East could trigger the kind of indiscriminate liquidation event in which all assets, including Bitcoin, sell off together.
Crucially, the behaviour of existing holders and long-term “diamondhand” accumulators needs to be monitored. Long-term holders—wallets that have held Bitcoin for 365 days or more—have sharply reduced their selling; the 30-day rolling net position change improved from -243,737 Bitcoin in early February to just -31,967 by March 1st, an 87% reduction. That is encouraging. But it does not yet constitute a confirmed trend reversal. Miners, too, have eased their capitulation, though negative hash-rate growth suggests the sector is still under stress. If a sustained trend of distribution emerges from either cohort, the bullish case weakens considerably.
Quinn Papworth
Quinn holds a Bachelor of Business from RMIT, majoring in Finance & Blockchain Enabled Business and has 4 years experience actively investing in crypto markets. Quinn is an analyst at Apollo Crypto and is deeply passionate about producing accessible crypto research content to help educate and onboard users.