categories
All Categories
- Bitcoin
- Centralised Exchanges
- Crypto
- Crypto Asset Volatility
- Crypto Correlations
- Crypto Governance
- Crypto in the Portfolio
- Crypto Valuations
- DeFi
- ESG
- Ethereum
- Investment Highlight
- Regulation
- Security and Privacy
- Social Media Influence
- Stable Coins
- Traditional Finance and Crypto
- Uncategorized
- UNSDG
- Web 3.0
Authors
All Authors

The P/E Ratio in Crypto
by David Angliss
A common question we are asked by our investors is, ‘How do you value crypto assets?’. There are many answers to this as the process of evaluating a crypto asset’s value can vary depending on its sector in the crypto asset industry, fundamentals, and functionality.
Crypto asset investors can analyse crypto assets via metrics common to the crypto asset industry and traditional finance. For example, crypto assets that fall into the DeFi category are often assessed with crypto-centric metrics such as Total Value Locked (TVL), fully diluted market capitalisation, circulating market capitalisation and traditional financial metrics such as the price to earnings ratio (P/E Ratio).
This blog post will clearly define these metrics and how we at Apollo Crypto use them to supplement our analysis. It is important to note, these metrics should not be used as the sole basis for an investment decision, but form part of a framework in conjunction with other fundamental analysis.
Crypto Metrics
To understand size and rankings of DeFi crypto assets, investors can analyse the following statistics:
- Circulating market capitalisation: Total value of crypto assets in circulation
- The circulating supply of tokens x Price per token
- Fully diluted market capitalisation: Total value of crypto assets that will be existence
- The maximum supply of tokens x Price per tokens
- TVL: The sum of all assets deposited in decentralised finance (DeFi) protocols earning rewards, interest, new coins
The higher these figures are relative to other crypto assets, the more mature and established the protocol. In addition, crypto assets with large, fully diluted market capitalisations relative to circulating supply indicate a significant amount of tokens will be released in the future which in turn could dilute the value of the asset.
P/E Ratios
The P/E is a popular metric as it gives investors insights into the value of the asset by portraying the expectations of the market and the price at which the investor must pay per unit of annual earnings.
With crypto assets the P/E formula most commonly used is:
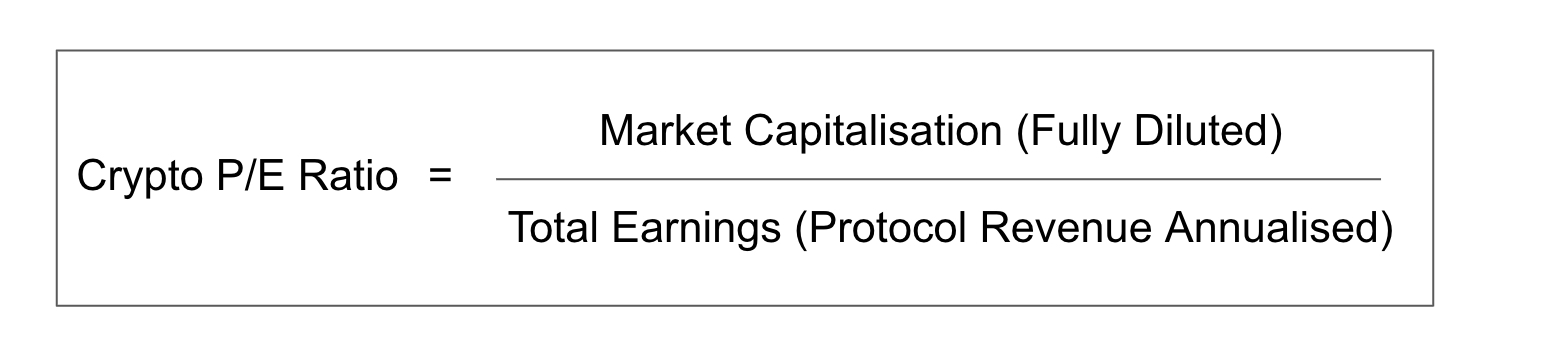
Total earnings in crypto assets refers to the annual revenue the protocol creates for the holders and can be done in different ways depending on the asset. For instance, the decentralised exchange tokens generate revenue to their users through liquidity provider fees, lending and borrowing protocols provide revenue in the form of total yield generated and layer one assets create revenue to participants (validators and miners) through transaction fees. Even though these participants are not necessarily holders of the layer one asset, this blog will still include P/E ratio analysis on these assets.
Different P/E Ratio Investors
Depending on an investor’s goals the P/E ratio figures can resonate differently. For value investors a low P/E ratio would be favoured as it implies the market is valuing the asset lower than its intrinsic value. Growth investors are more enticed to buy assets with a higher P/E ratio based on the thought that the higher rate of earnings growth and absolute value of the earnings validates the high P/E ratio.
Crypto investors like traditional equity investors will not base an investment decision on a low or high P/E Ratio. Instead, they will use it as one source of information among many within an investment decision-making matrix.
Layer One Crypto Assets
Layer one crypto asset’s protocol revenue annualized is calculated by the total revenue the protocol generates in transaction fees from users of the blockchain.
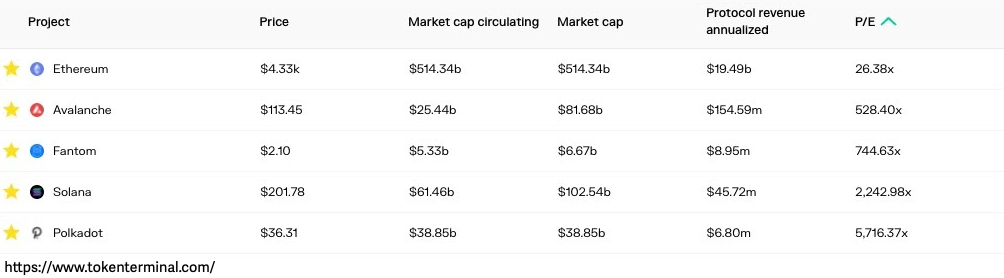
Layer one blockchain assets are the least suitable to analyse using P/E ratios from all the examples provided in this blog. This is due to the fact that the protocol revenue is not attributable to the asset holders. However, this protocol revenue along with the crypto metrics can give investors a gauge on the overall maturity of the layer one asset.
Reviewing the table, Ethereum clearly distinguishes itself as the value asset with the highest crypto metrics and lowest P/E ratio. On the other hand, Avalanche and Fantom, with high P/E ratios, appear overvalued, whilst the remainders could be seen as highly overvalued or speculative.
Decentralised Exchanges and Trading Platforms
Decentralised Exchanges (DEX) and trading platform assets generate their revenue from the fees associated with using the protocol. These would typically be distributed to the liquidity providers, providing the assets to the AMMs to allow for permissionless trading. 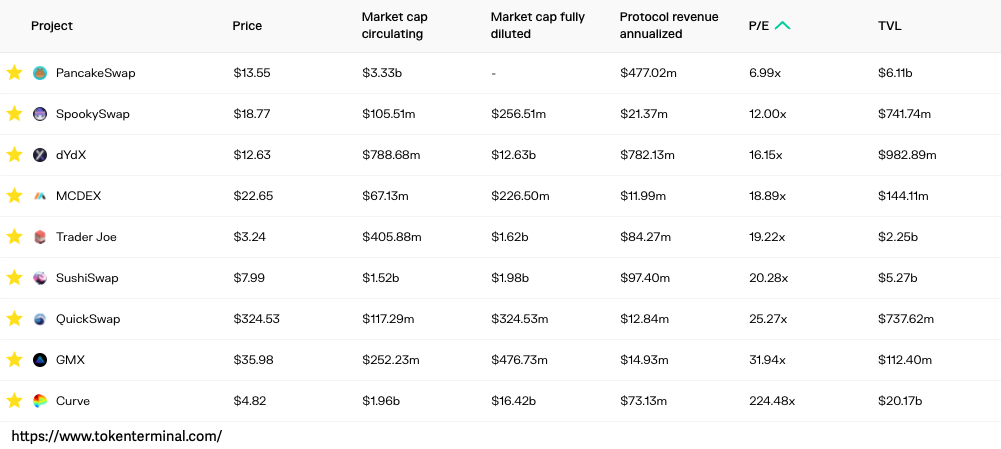
These assets are most receptive to P/E ratio analysis. PancakeSwap, the number one DEX on Binance Smart Chain, is one of the oldest protocols in the table above. It also has the second highest total value locked. Similarly to Ethereum in the previous example, it could be categorised as a well-established value asset.
GMX is on the other end of the table as one of the youngest protocols, with a P/E ratio of 31.94. GMX is a speculative derivatives trading platform with solid price performance since its inception in September 2021. The high P/E ratio in this instance could be justified and attractive to an investor seeking growth assets.
SushiSwap and Trader Joe are two protocols to review closely in this table. Both have high P/E ratios and the second and third largest circulating market capitalisations. As a result, investors could view the price relative to PankcakeSwap as being overpriced.
Curve Finance has maintained an extremely high valuation despite weak earnings from trading fees distributed to the CRV holders. Curve Finance is a market leader in decentralised stablecoin swapping. However, with a P/E of 224.48, a 10x multiple higher than the other large DEXs, the market’s expectations might be too large.
Compared to the layer one blockchain assets, the P/E ratio can provide more relevant insights when used on DEX and trading platform assets.
Decentralised Borrowing and Lending Protocols
The P/E Ratio can be particularly relevant for decentralised money market assets. This segment displays a wide P/E ratio range of 9 to 241, with the mean P/E for these protocols being higher than the exchange and trading platform protocols. As a result, this table can reveal some crypto assets that the market is potentially unnoticing and overvaluing.
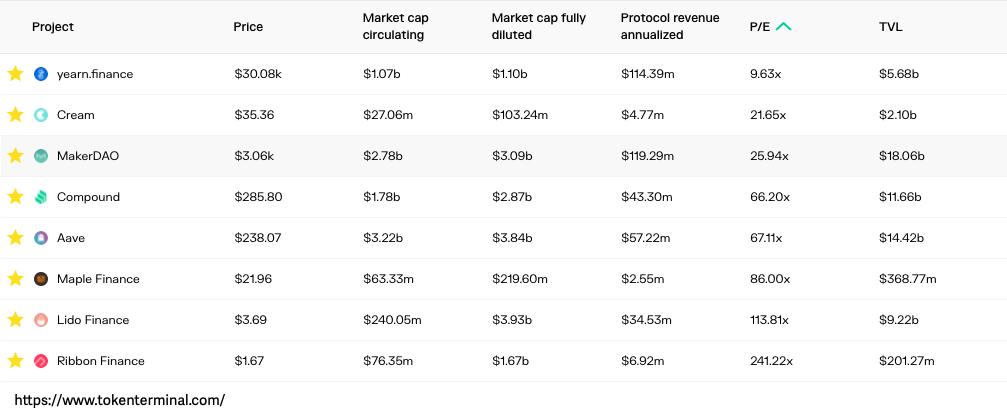
The first crypto asset that stands out in this table is yearn.finance. Like the previous two tables displayed, the asset with the lowest P/E in its class has been a market leader and a value asset. Yearn.finance, considered a blue-chip DeFi, is an asset that generates revenue through total yield generated as an aggregator for liquidity pools. It’s circulating market capitalisation is average sized and it is the only asset with a P/E ratio in the single digits, indicating much stronger earnings relative to price than its counterparts. Purely from this table and the P/E ratio, a value investor would suggest this asset is undervalued.
Using the basic crypto metrics, Compound and Aave are market leaders in the decentralised borrowing and lending sector, with top three ranked TVL and circulating market capitalisation figures. Being market leaders, an analyst may deduce a P/E ratio of approximately 60 could be a standard benchmark in this DeFi category.
Maple Finance, Lido Finance and Ribbon Finance are all relatively new DeFi protocols that have a higher P/E Ratio probably due to market expectations of strong growth.
Conclusion
Looking at crypto assets through the lens of the P/E Ratio means evaluating them based on their protocol revenue relative to their size, and basic crypto metrics help establish comparisons for investors to rank assets based upon circulating market capitalisation and TVL. In addition, most of the crypto assets provided in this blog can generate earnings for crypto asset holders, similarly to investors investing in specific stocks. In unison with several other fundamental analysis tools, these shared properties lend the P/E Ratio as a suitable tool for valuing certain DeFi crypto assets.
David Angliss
David is an analyst at Apollo Crypto with five years of crypto-asset investing experience. He contributes to the investment team by researching crypto-assets across the innovative contract platform, DeFi assets and NFT and Metaverse infrastructure categories. David also assists with the day-to-day activities of market-neutral strategies by analysing yields, evaluating smart audits, and facilitating crypto-asset transactions.